Figures produced across the aimez research program, gathered here so the camera pipeline, the routing work and the validation results can be read in one place.
Camera vision pipeline
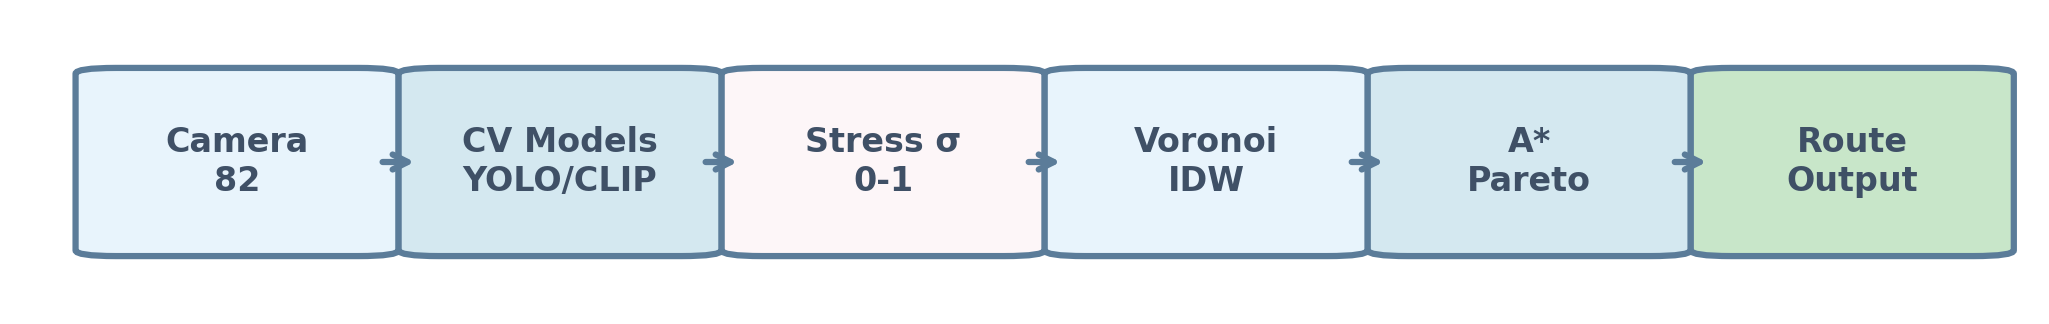
The pipeline reads public traffic-camera frames and turns them into a continuous stress field that routing can use. The stages run from camera frame through computer-vision detection to an interpolated field and a Pareto route.
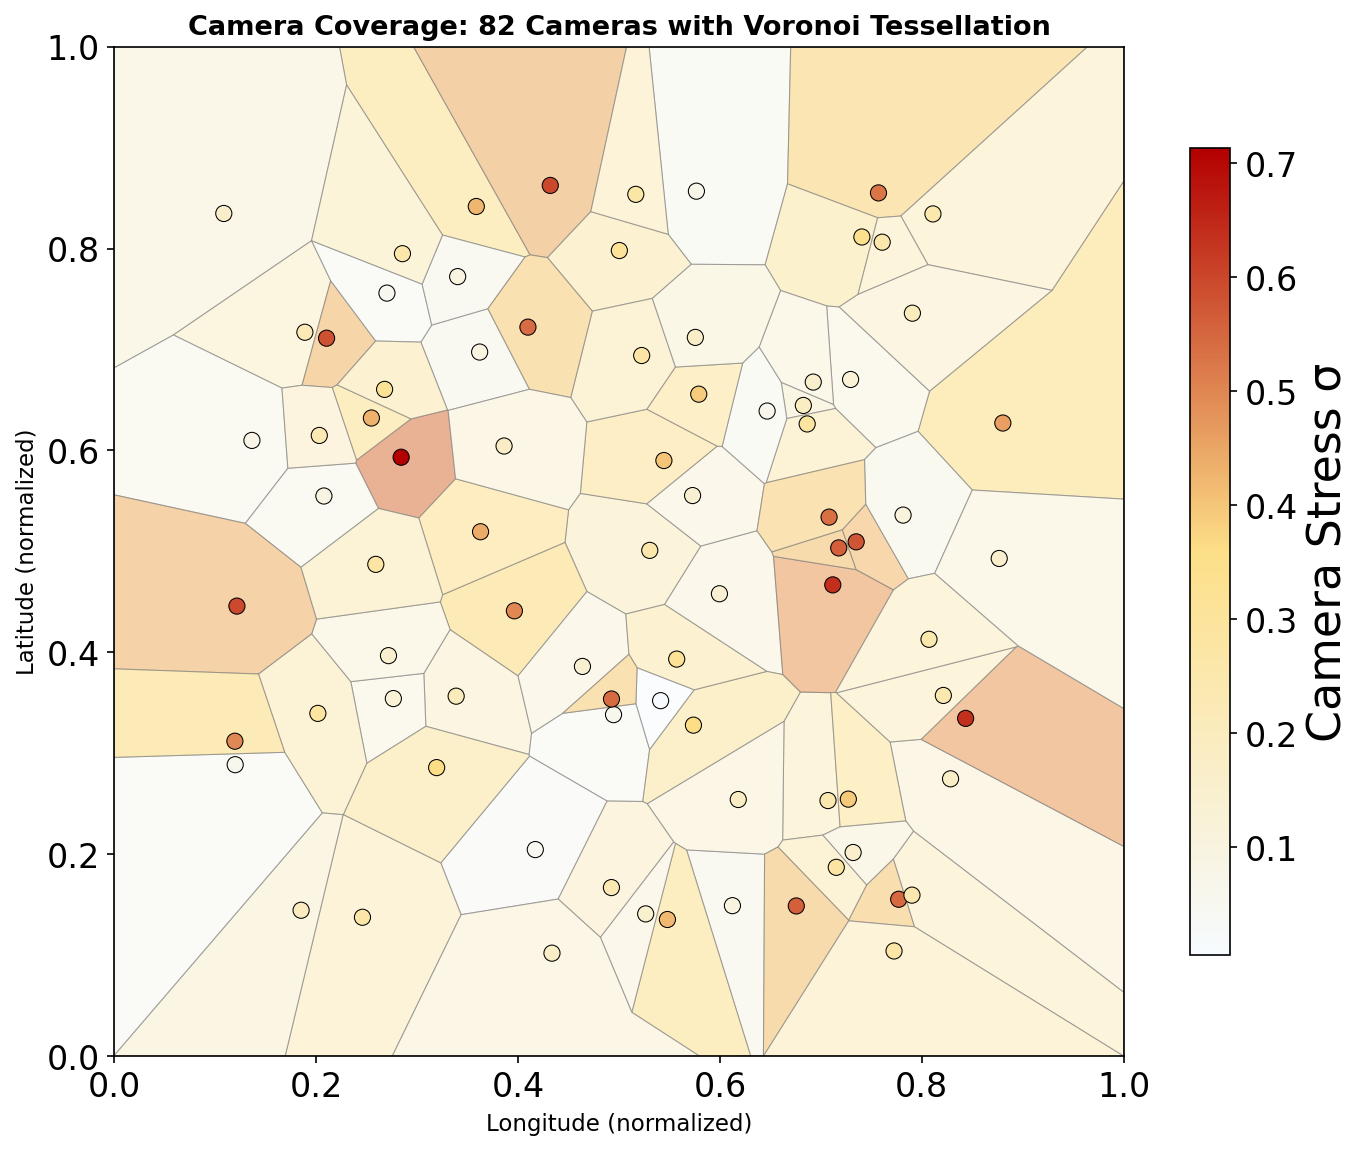
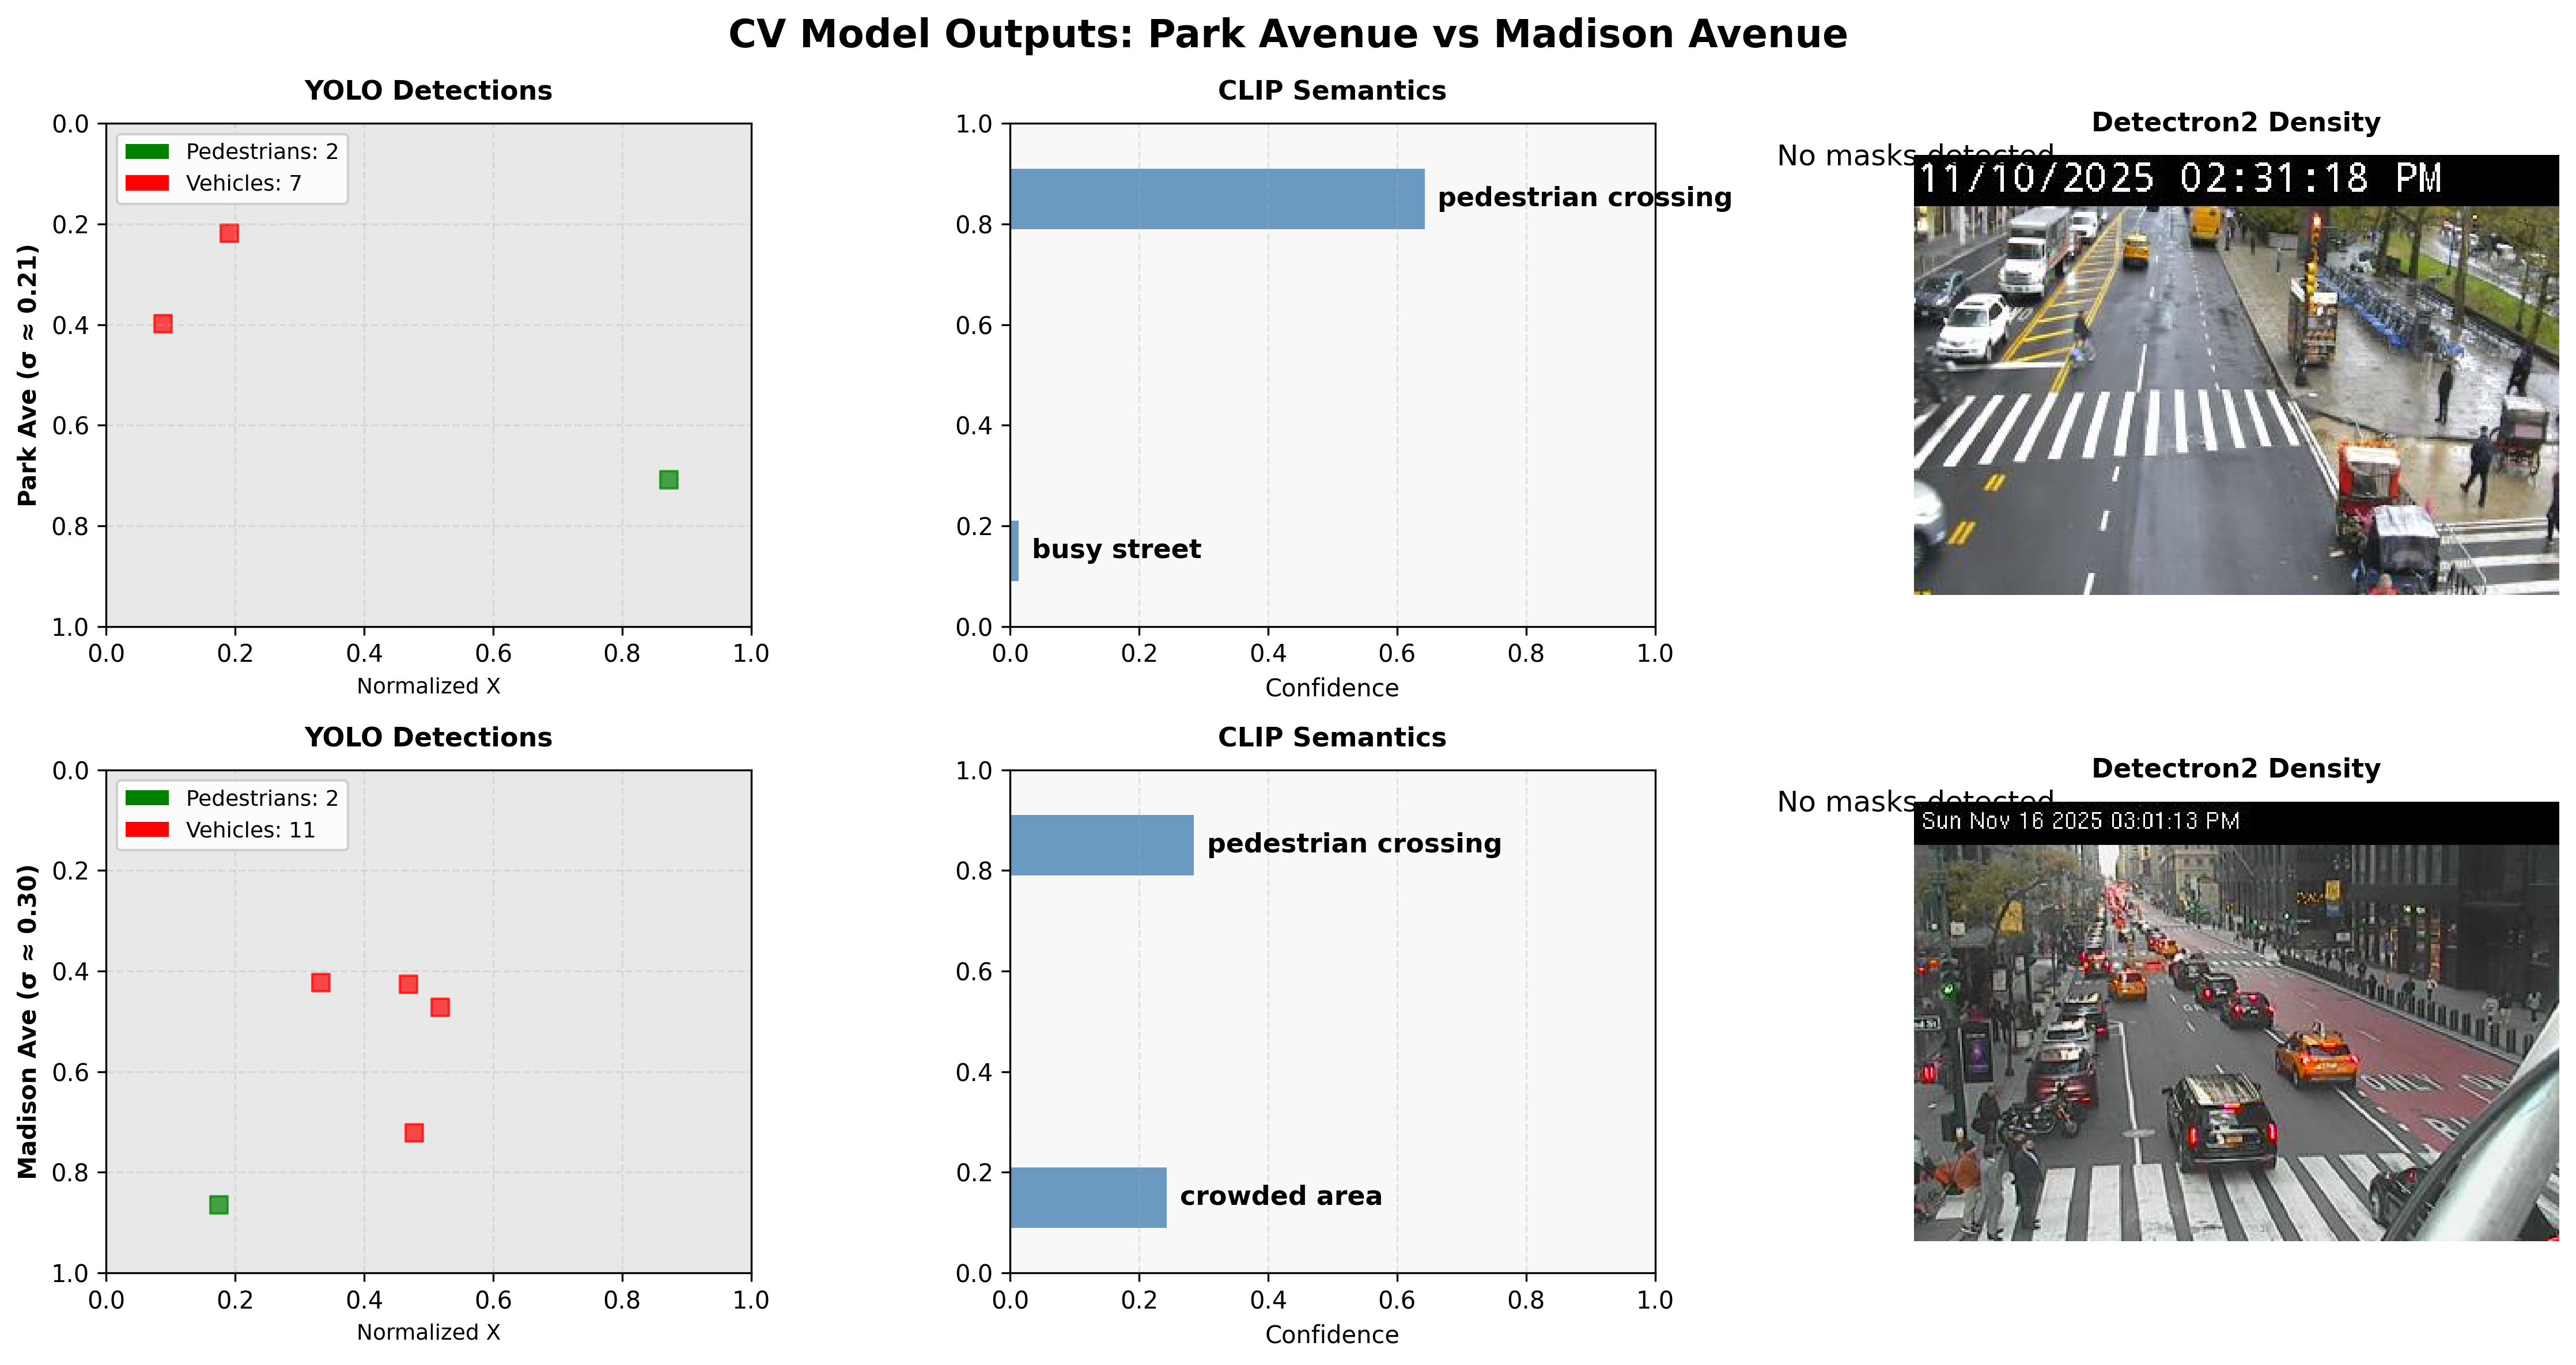
The full pipeline: 82 cameras feed YOLO and CLIP models, which produce a per-camera stress value from 0 to 1, interpolated by Voronoi and inverse-distance weighting and consumed by an A* Pareto router that returns a route.Camera coverage across the study area, with 82 cameras and a Voronoi tessellation. Cell color encodes camera stress sigma, where warmer cells carry more measured stress.Model outputs at two locations: YOLO pedestrian and vehicle detections, CLIP scene semantics and Detectron2 density on real camera frames. Park Avenue reads at stress sigma near 0.21 and Madison Avenue near 0.30.
Mobility and routing
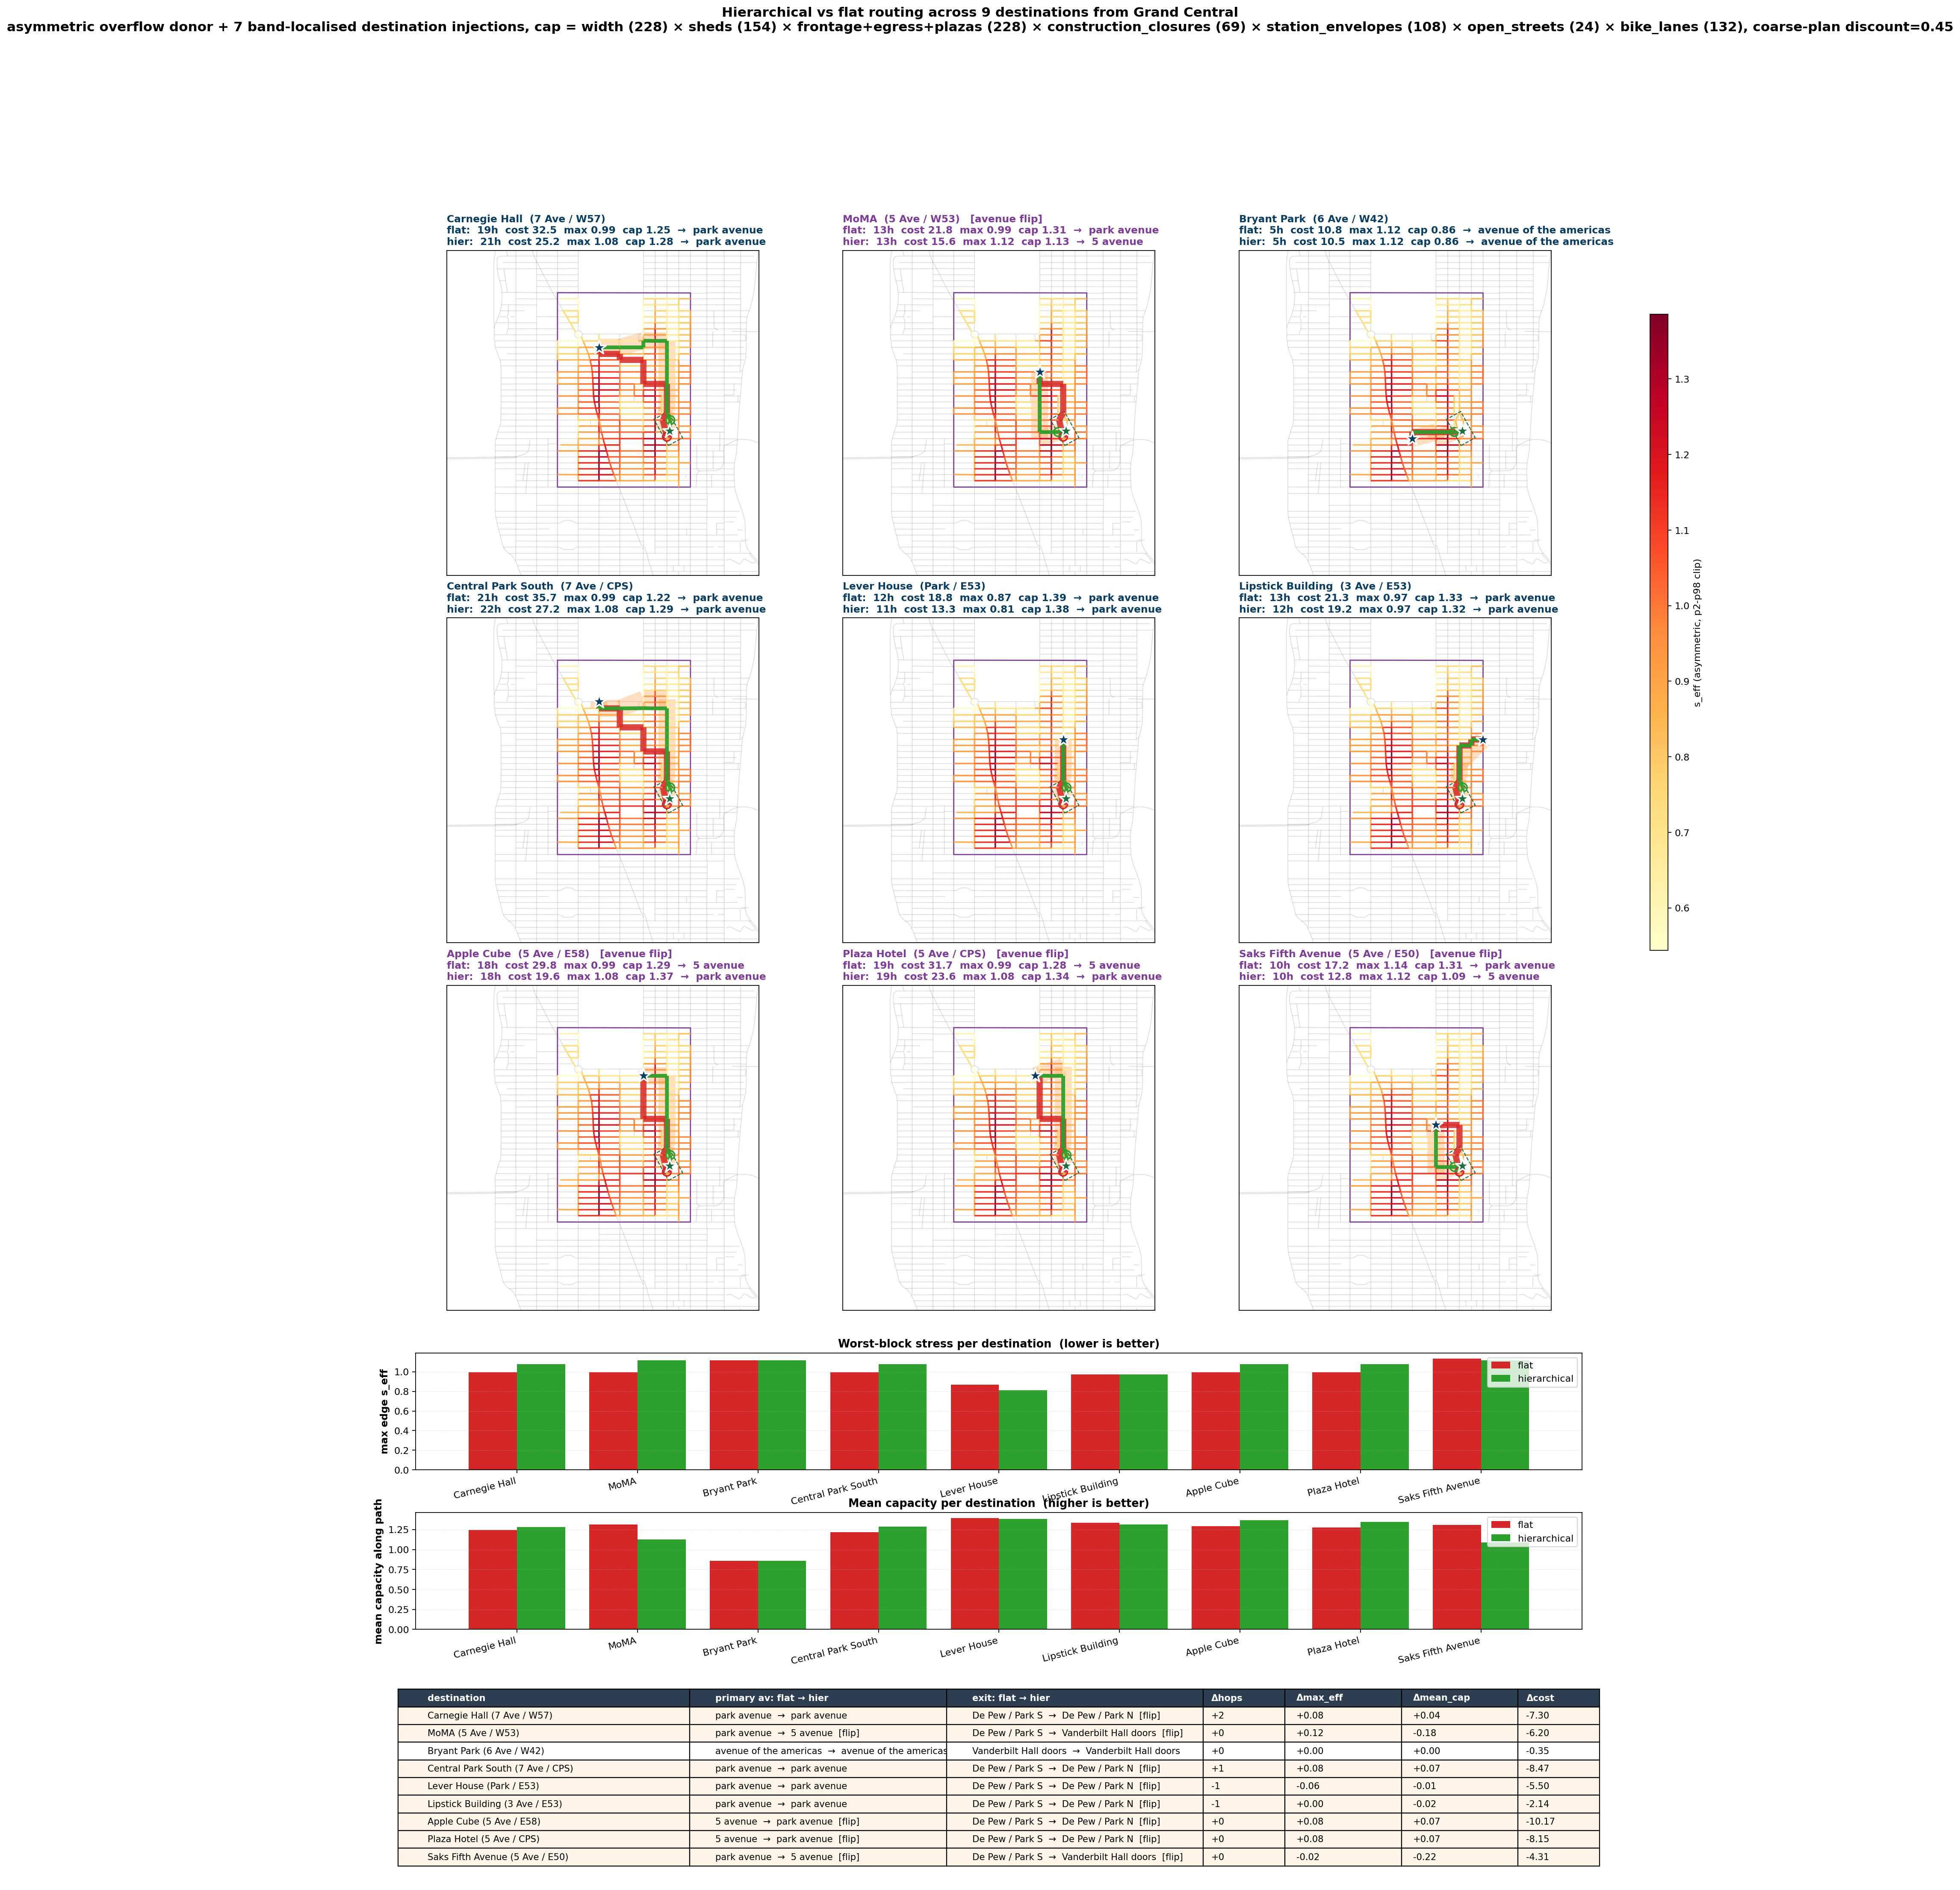
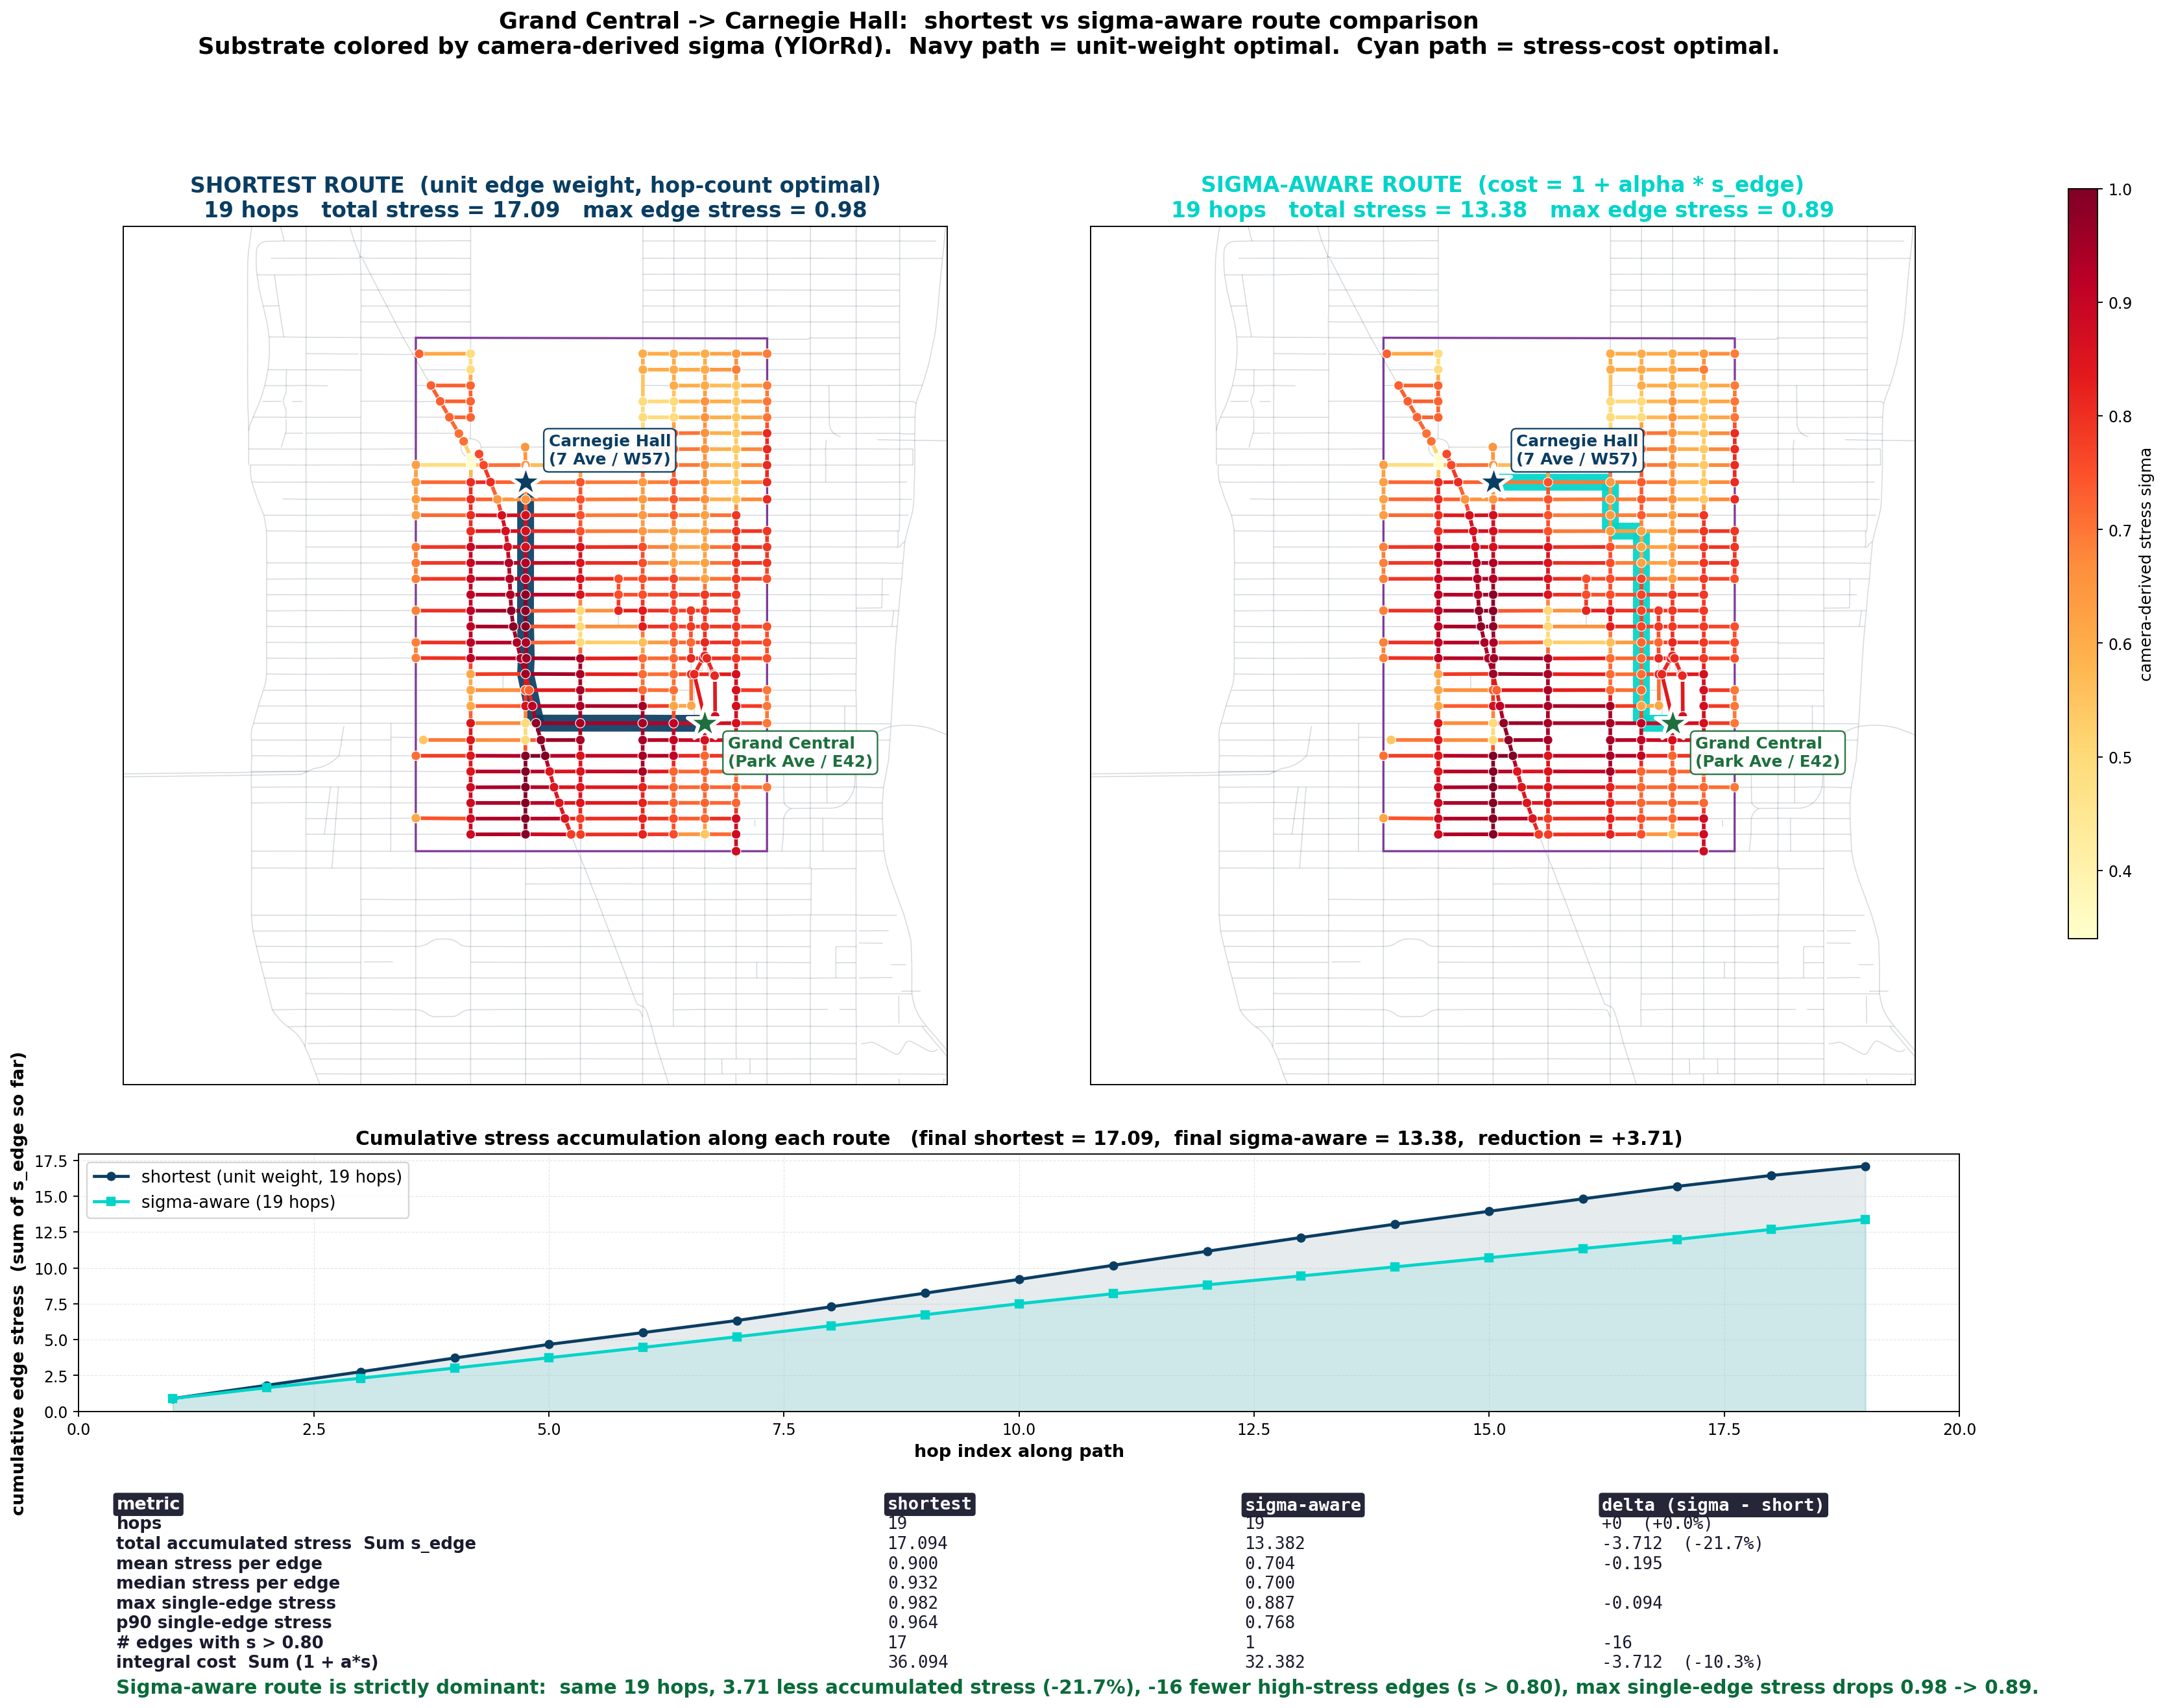
These panels compare the fastest route against routes that respect measured burden, and they show how load redistributes when the network is under stress.
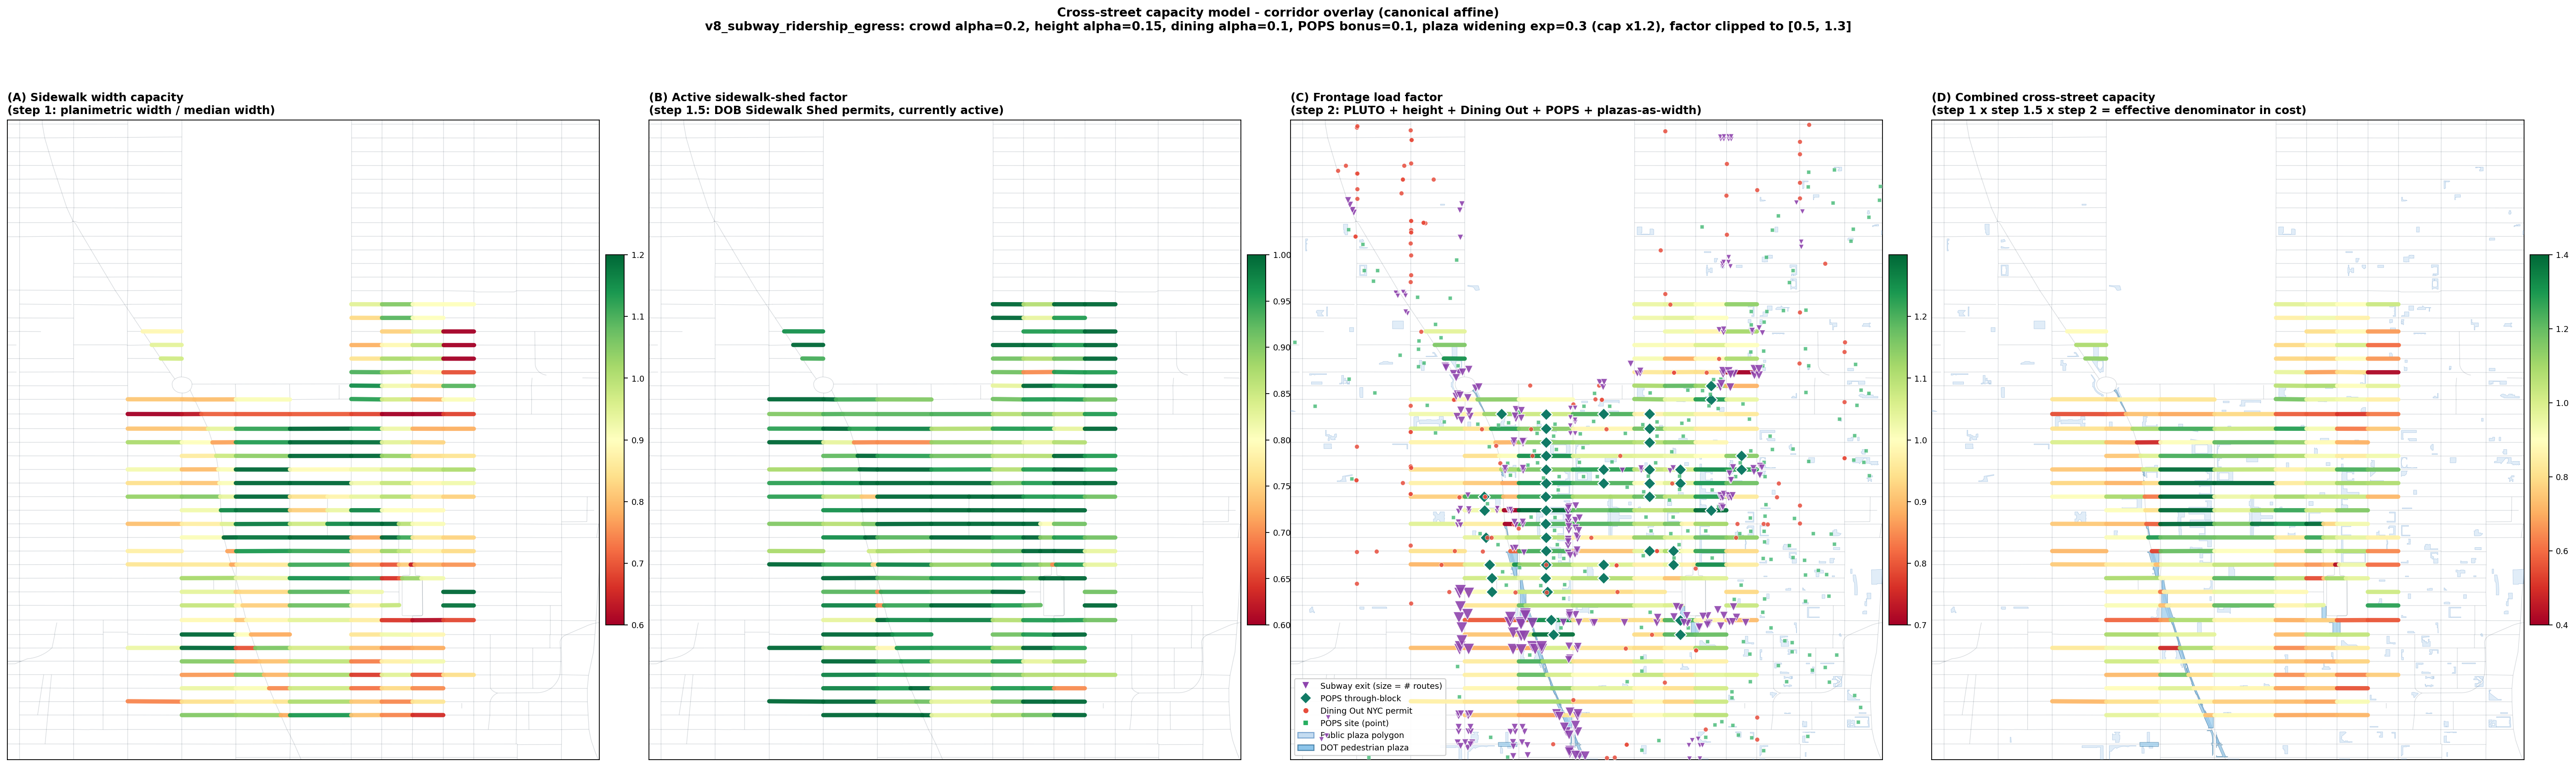
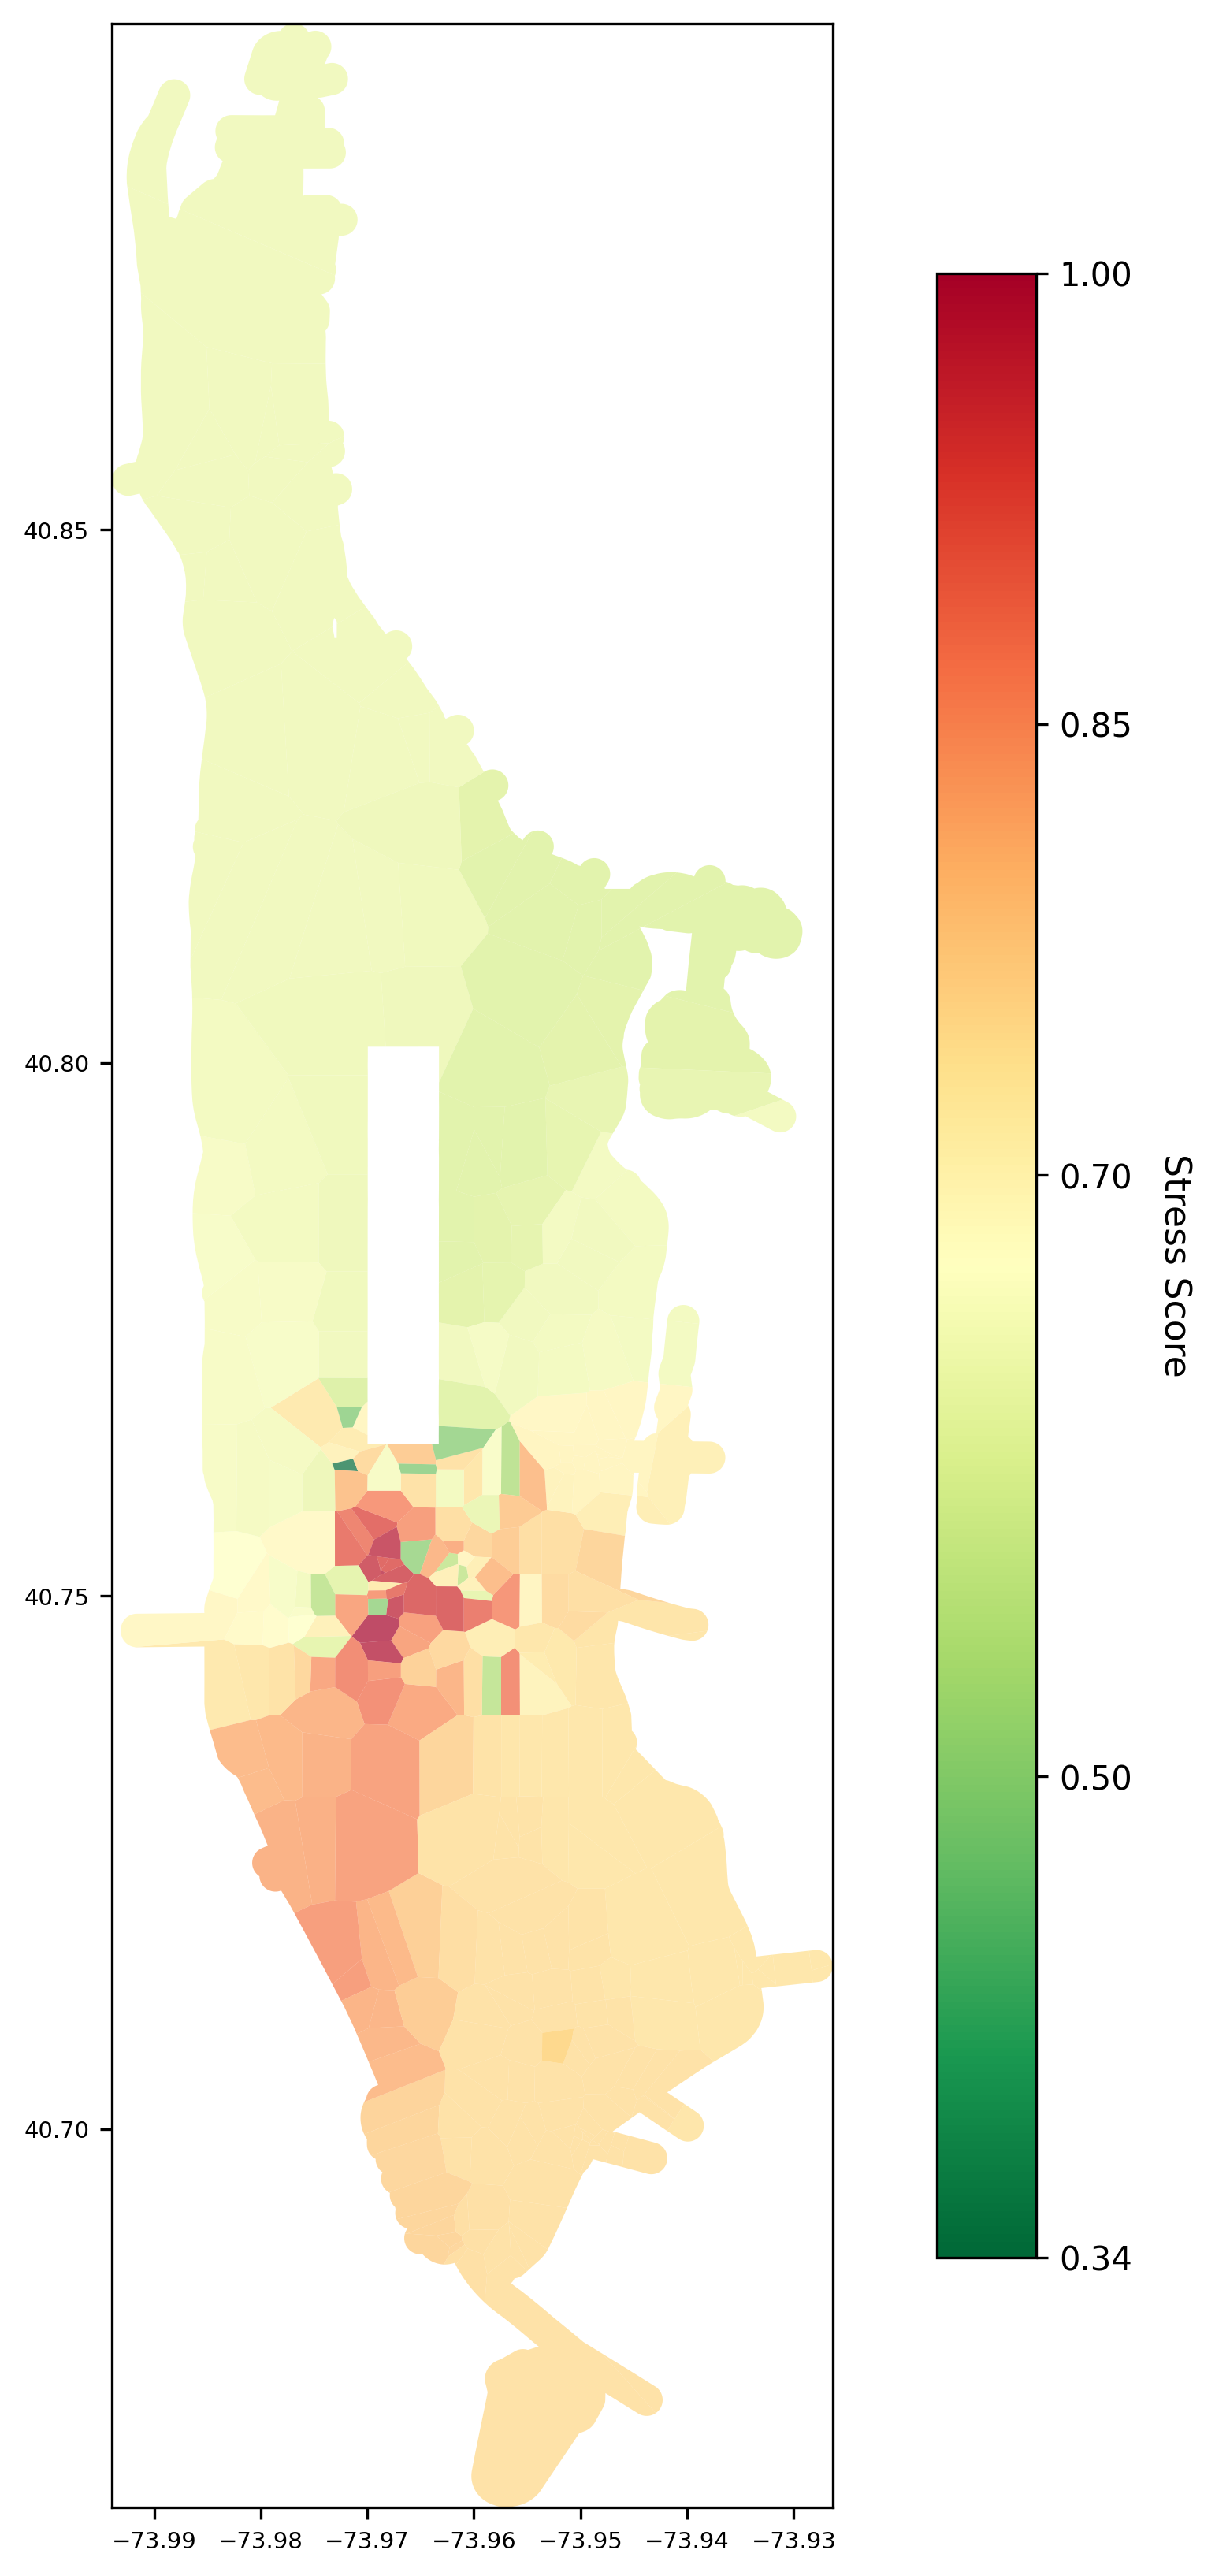
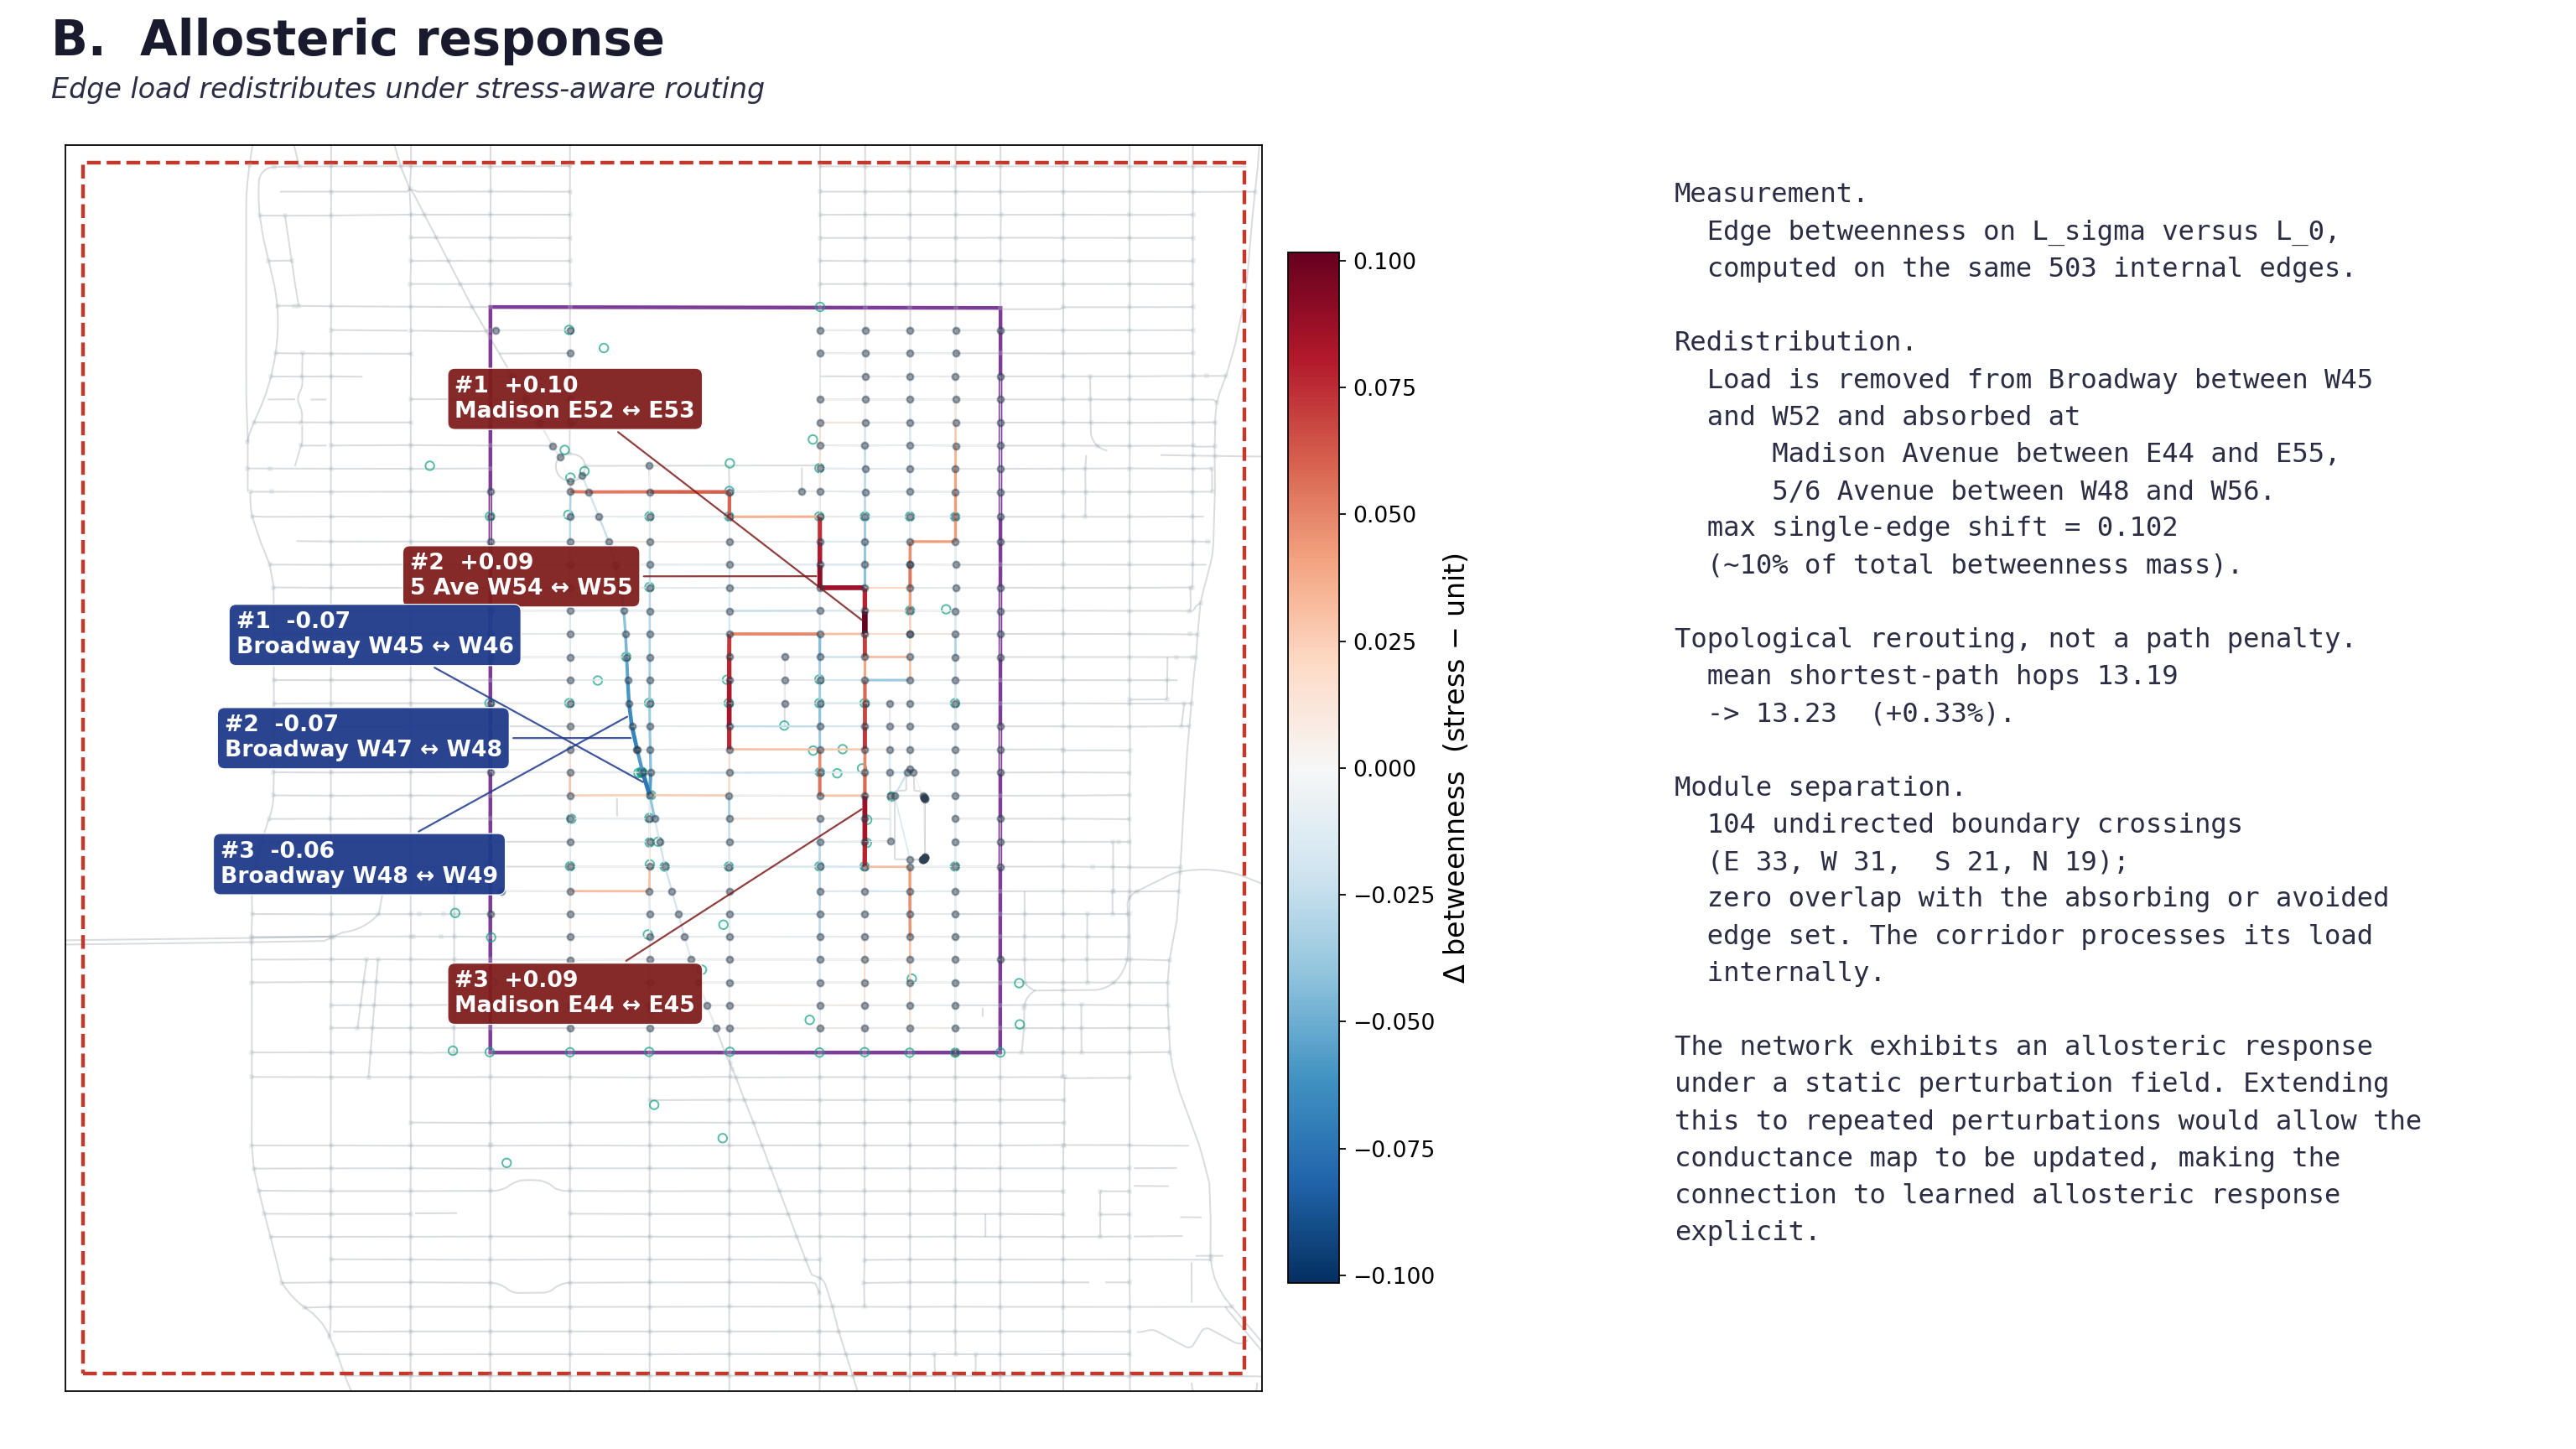
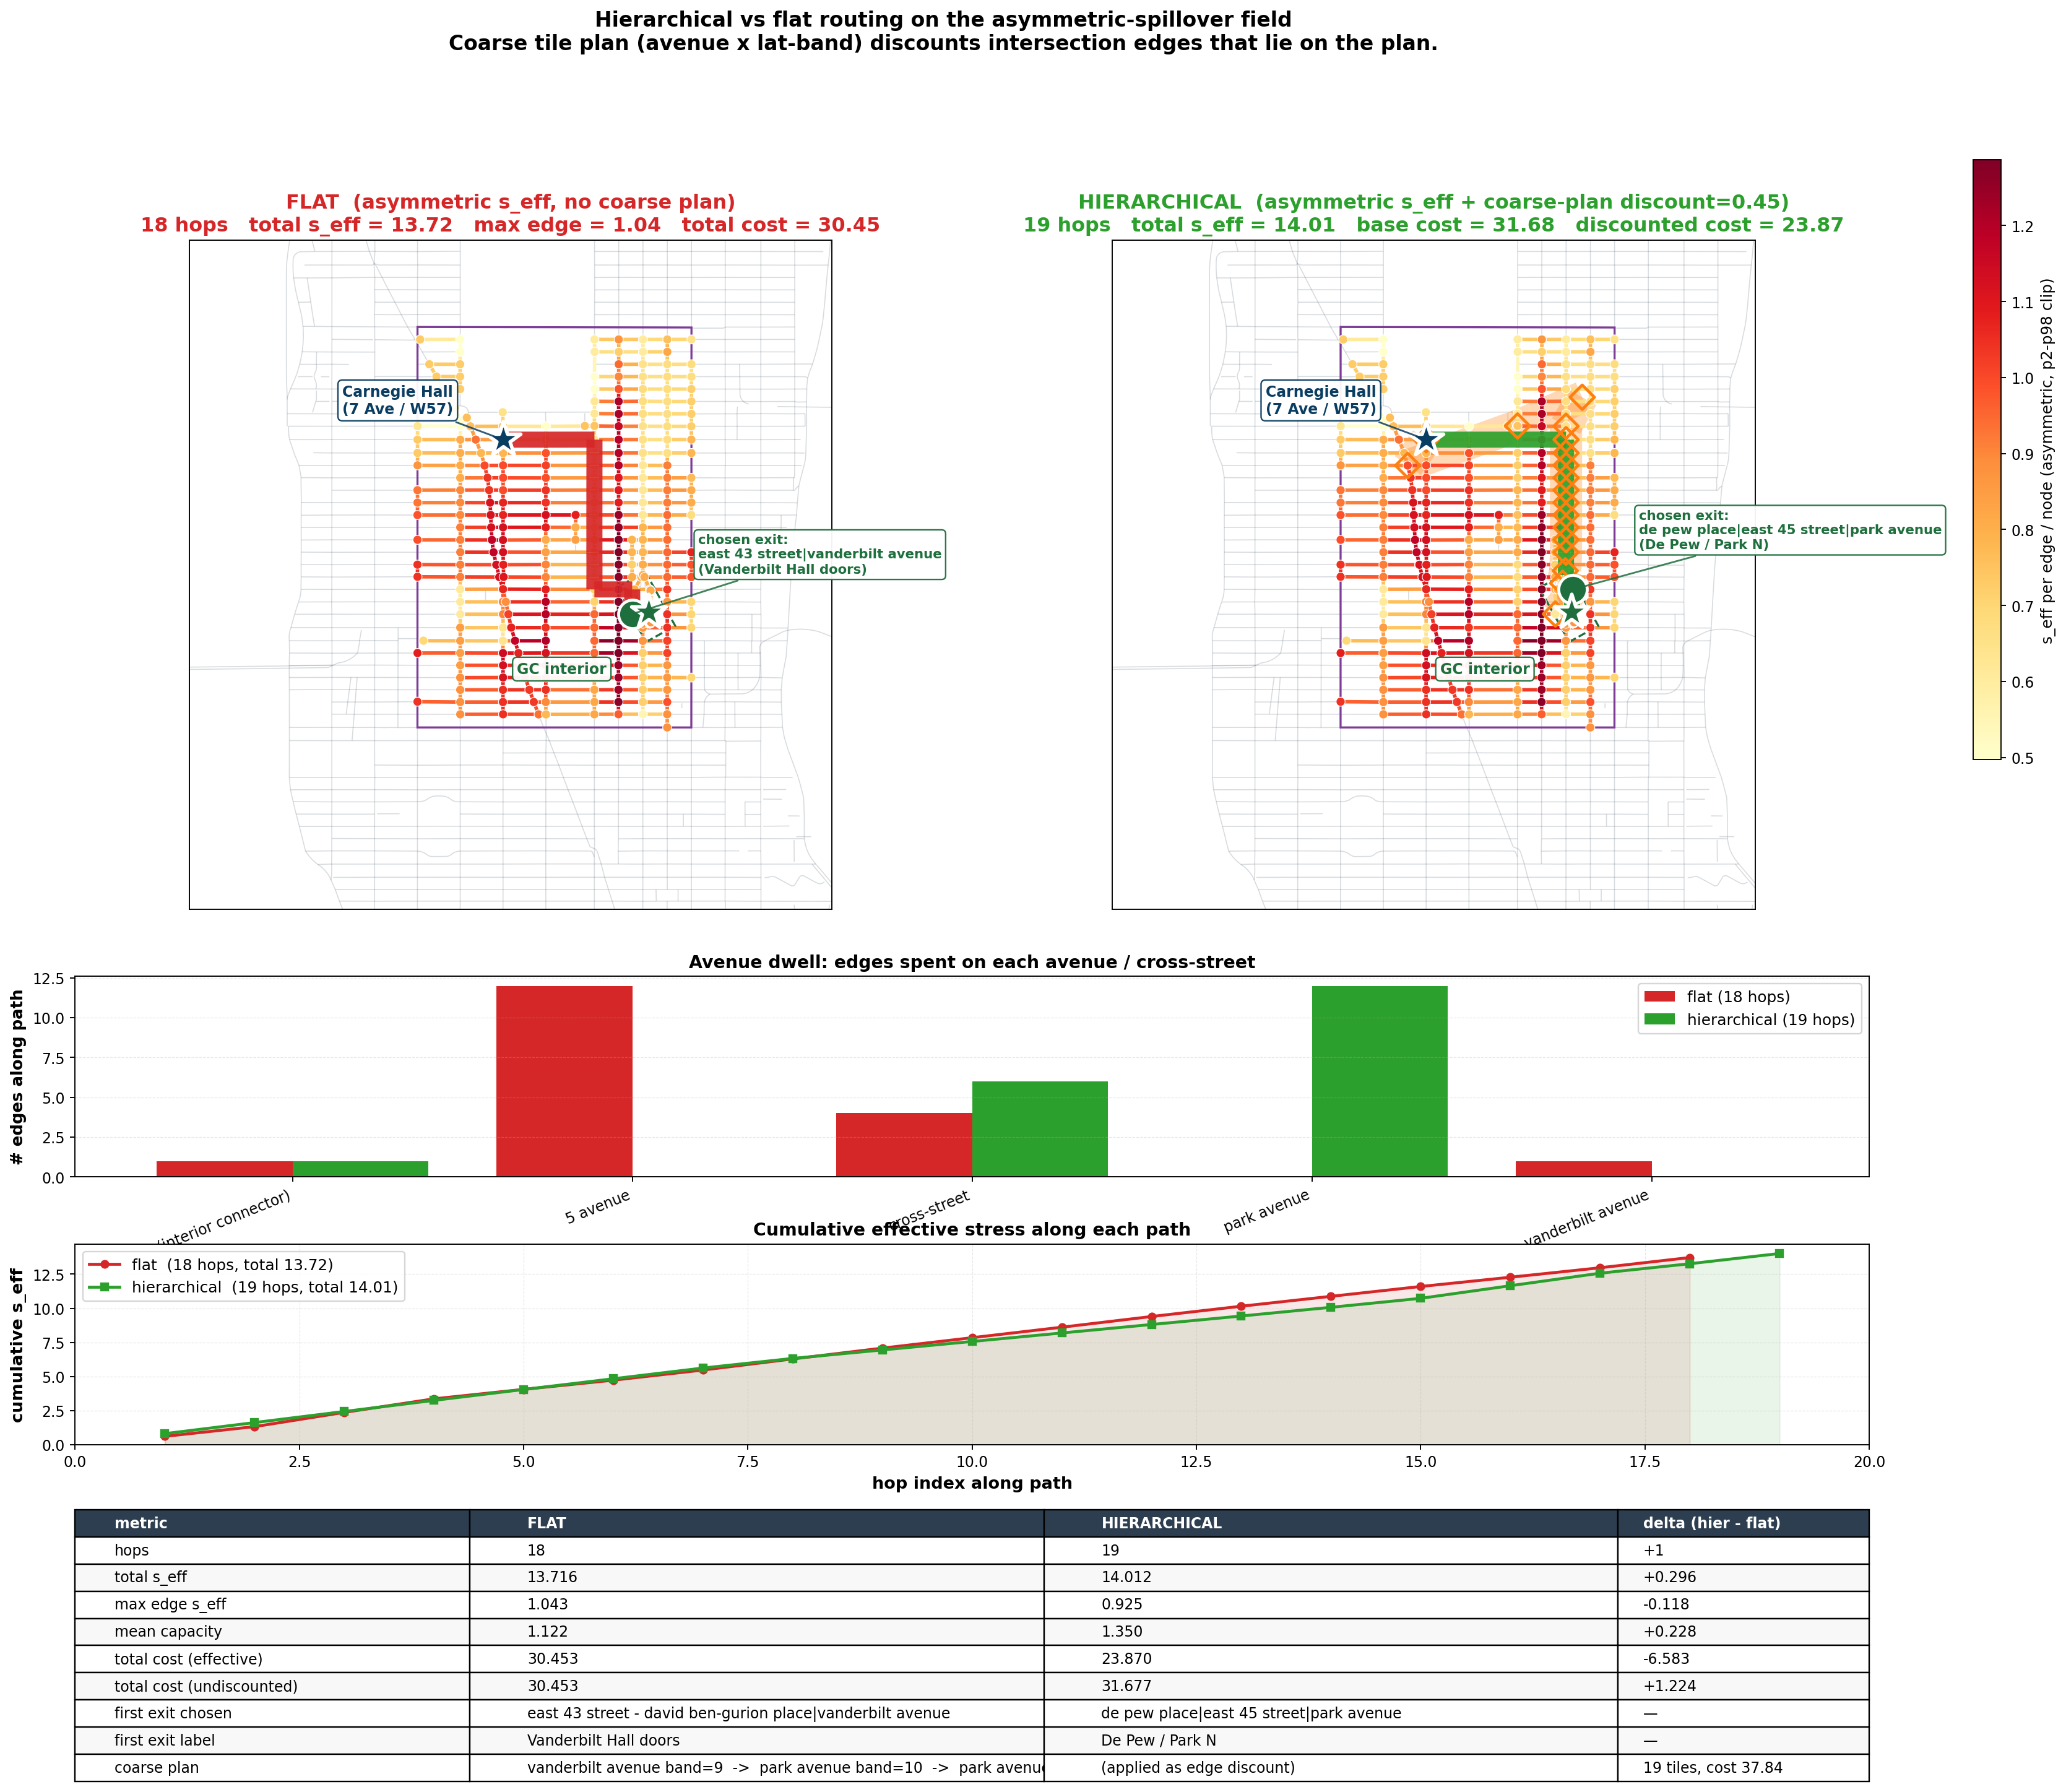
The fastest route compared against a feasible route that respects measured burden, showing where the two diverge.Feasible routes across a grid of destinations, mapping where access stays open and where it narrows.Measured burden overlaid on network capacity layers, so the cost surface and the supply structure read together.A risk heatmap built from the camera stress field, marking the areas a stress-aware route works to avoid.Load redistribution when the network is under stress, showing how traffic moves onto alternate corridors.Hierarchical routing across capacity layers, where the path selection respects both distance and supply.
StreetLight validation
A route comparison from the StreetLight validation work, placing the model output beside an external movement estimate.