Canonical figures
Substrate before navigation
Published figures in build order
Measure → topology → supply → routing → validation. Captions match the manuscript chain.
Patent pending. ← → or space to advance.
Methods
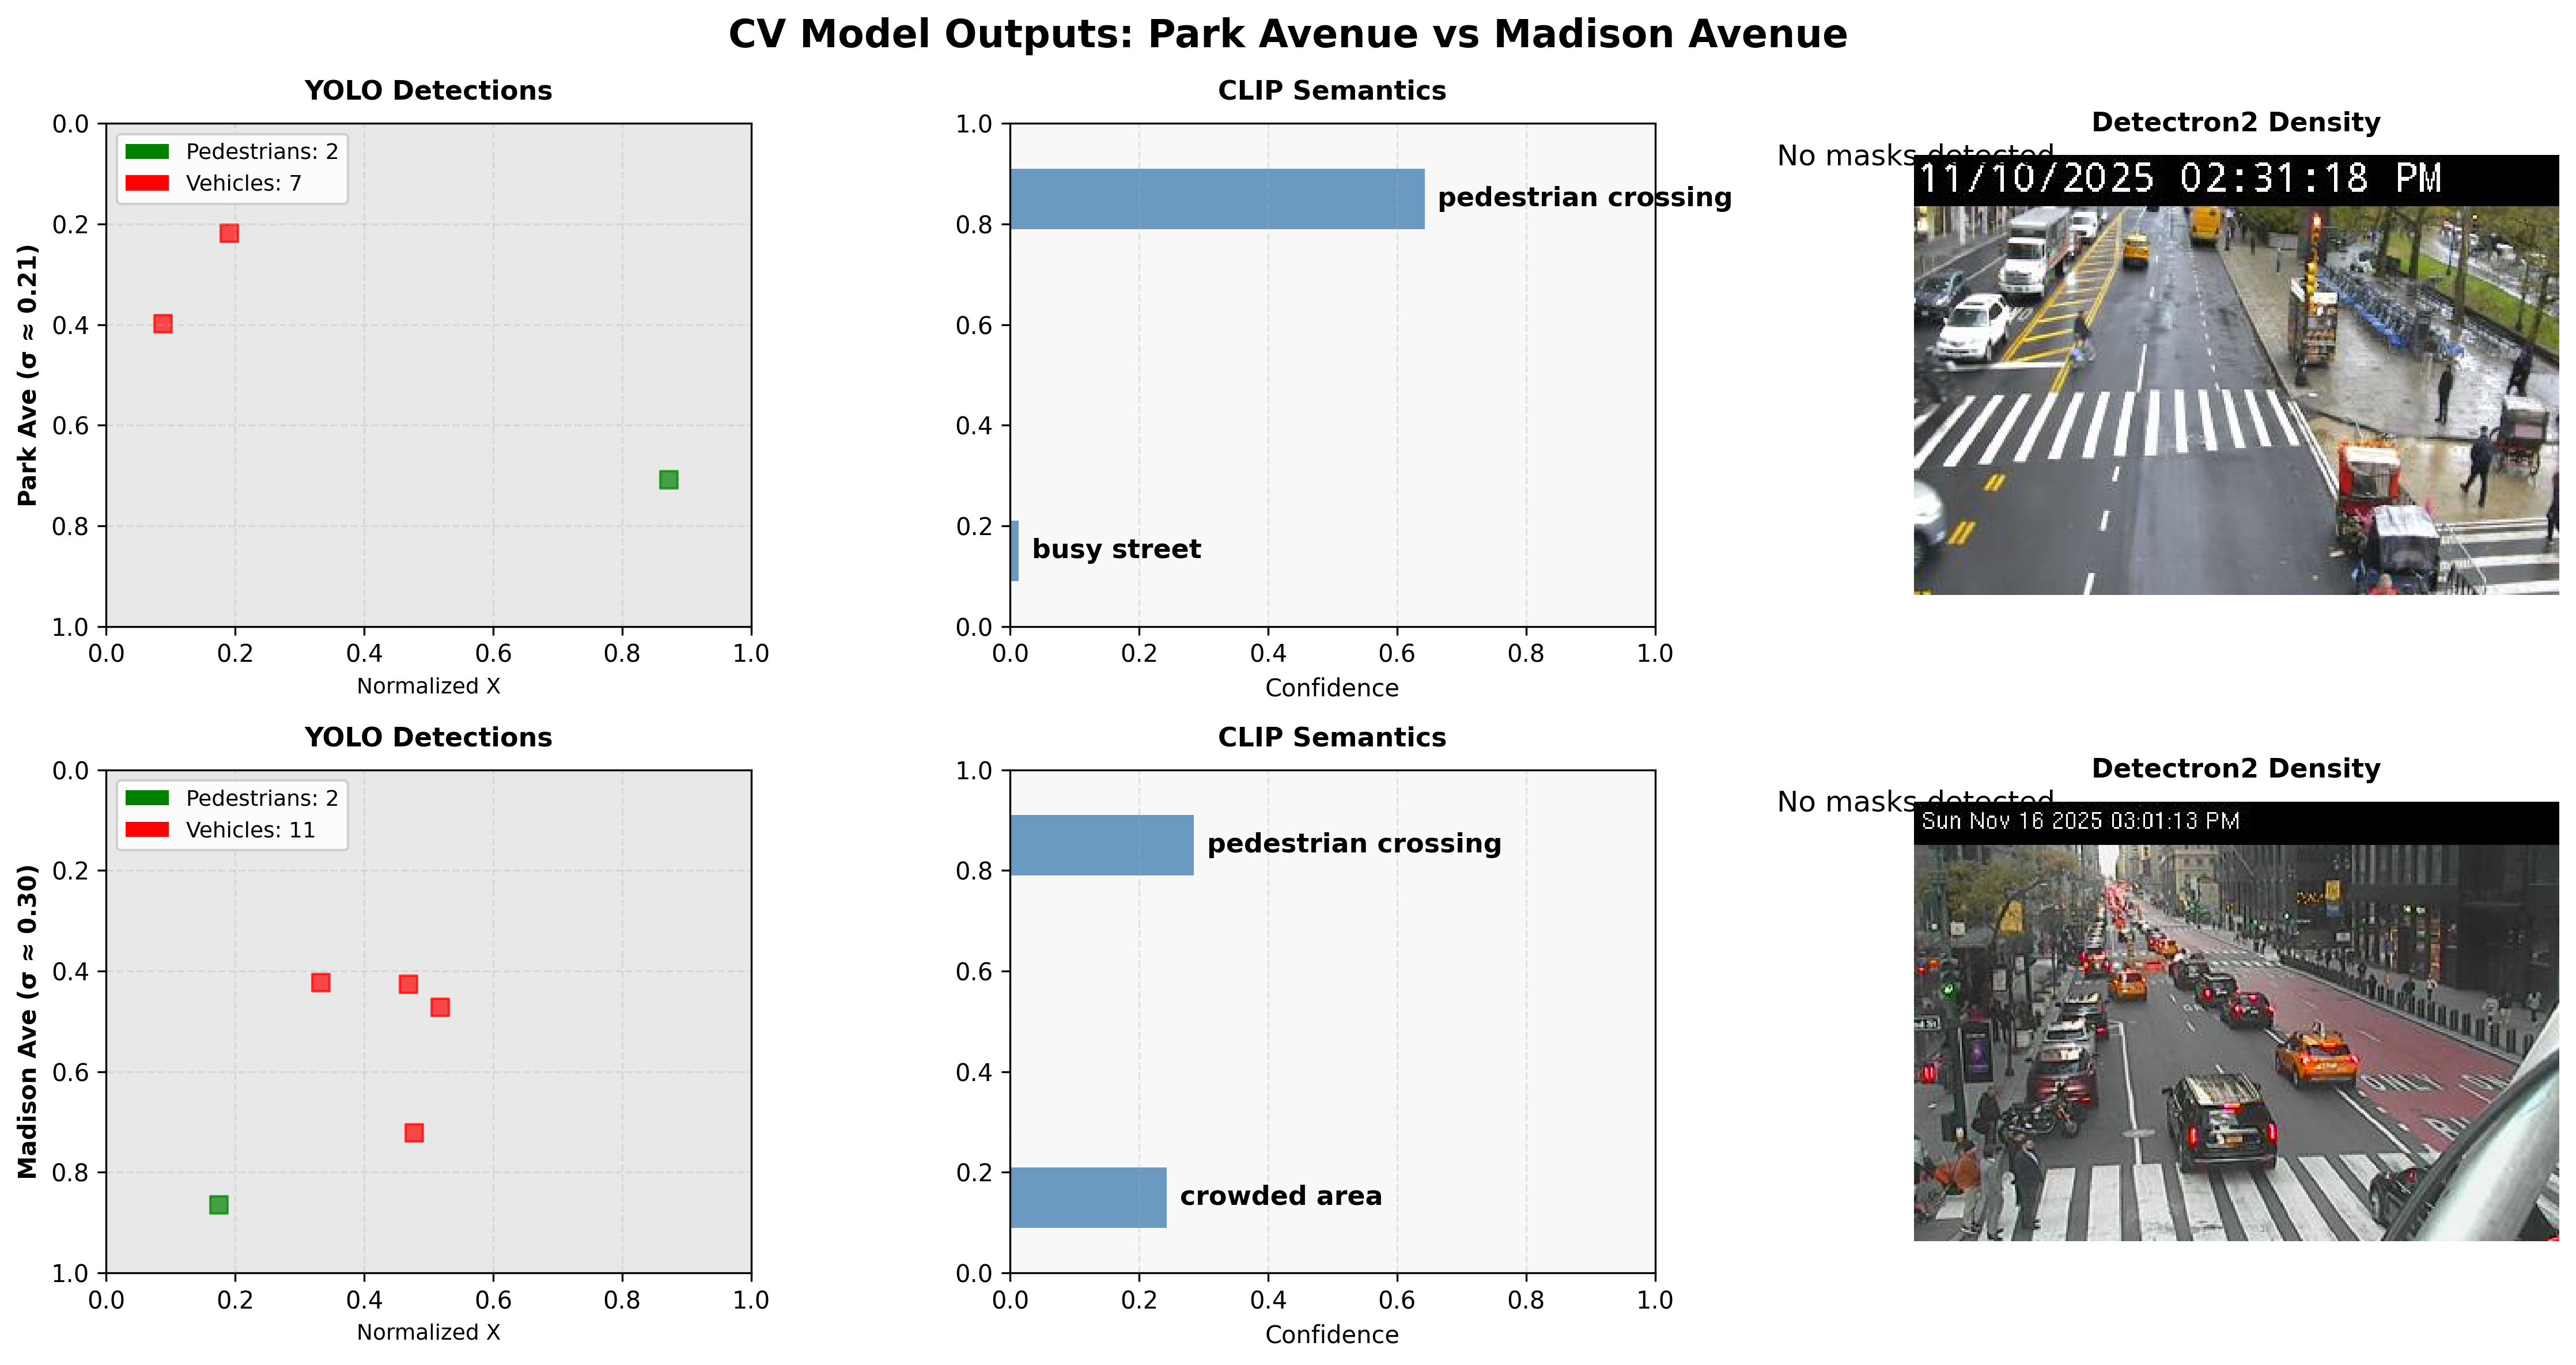
Representation pipeline
Real DOT camera frames with model overlays. Demand grounded in observation.
§2.1 · Emergent topology
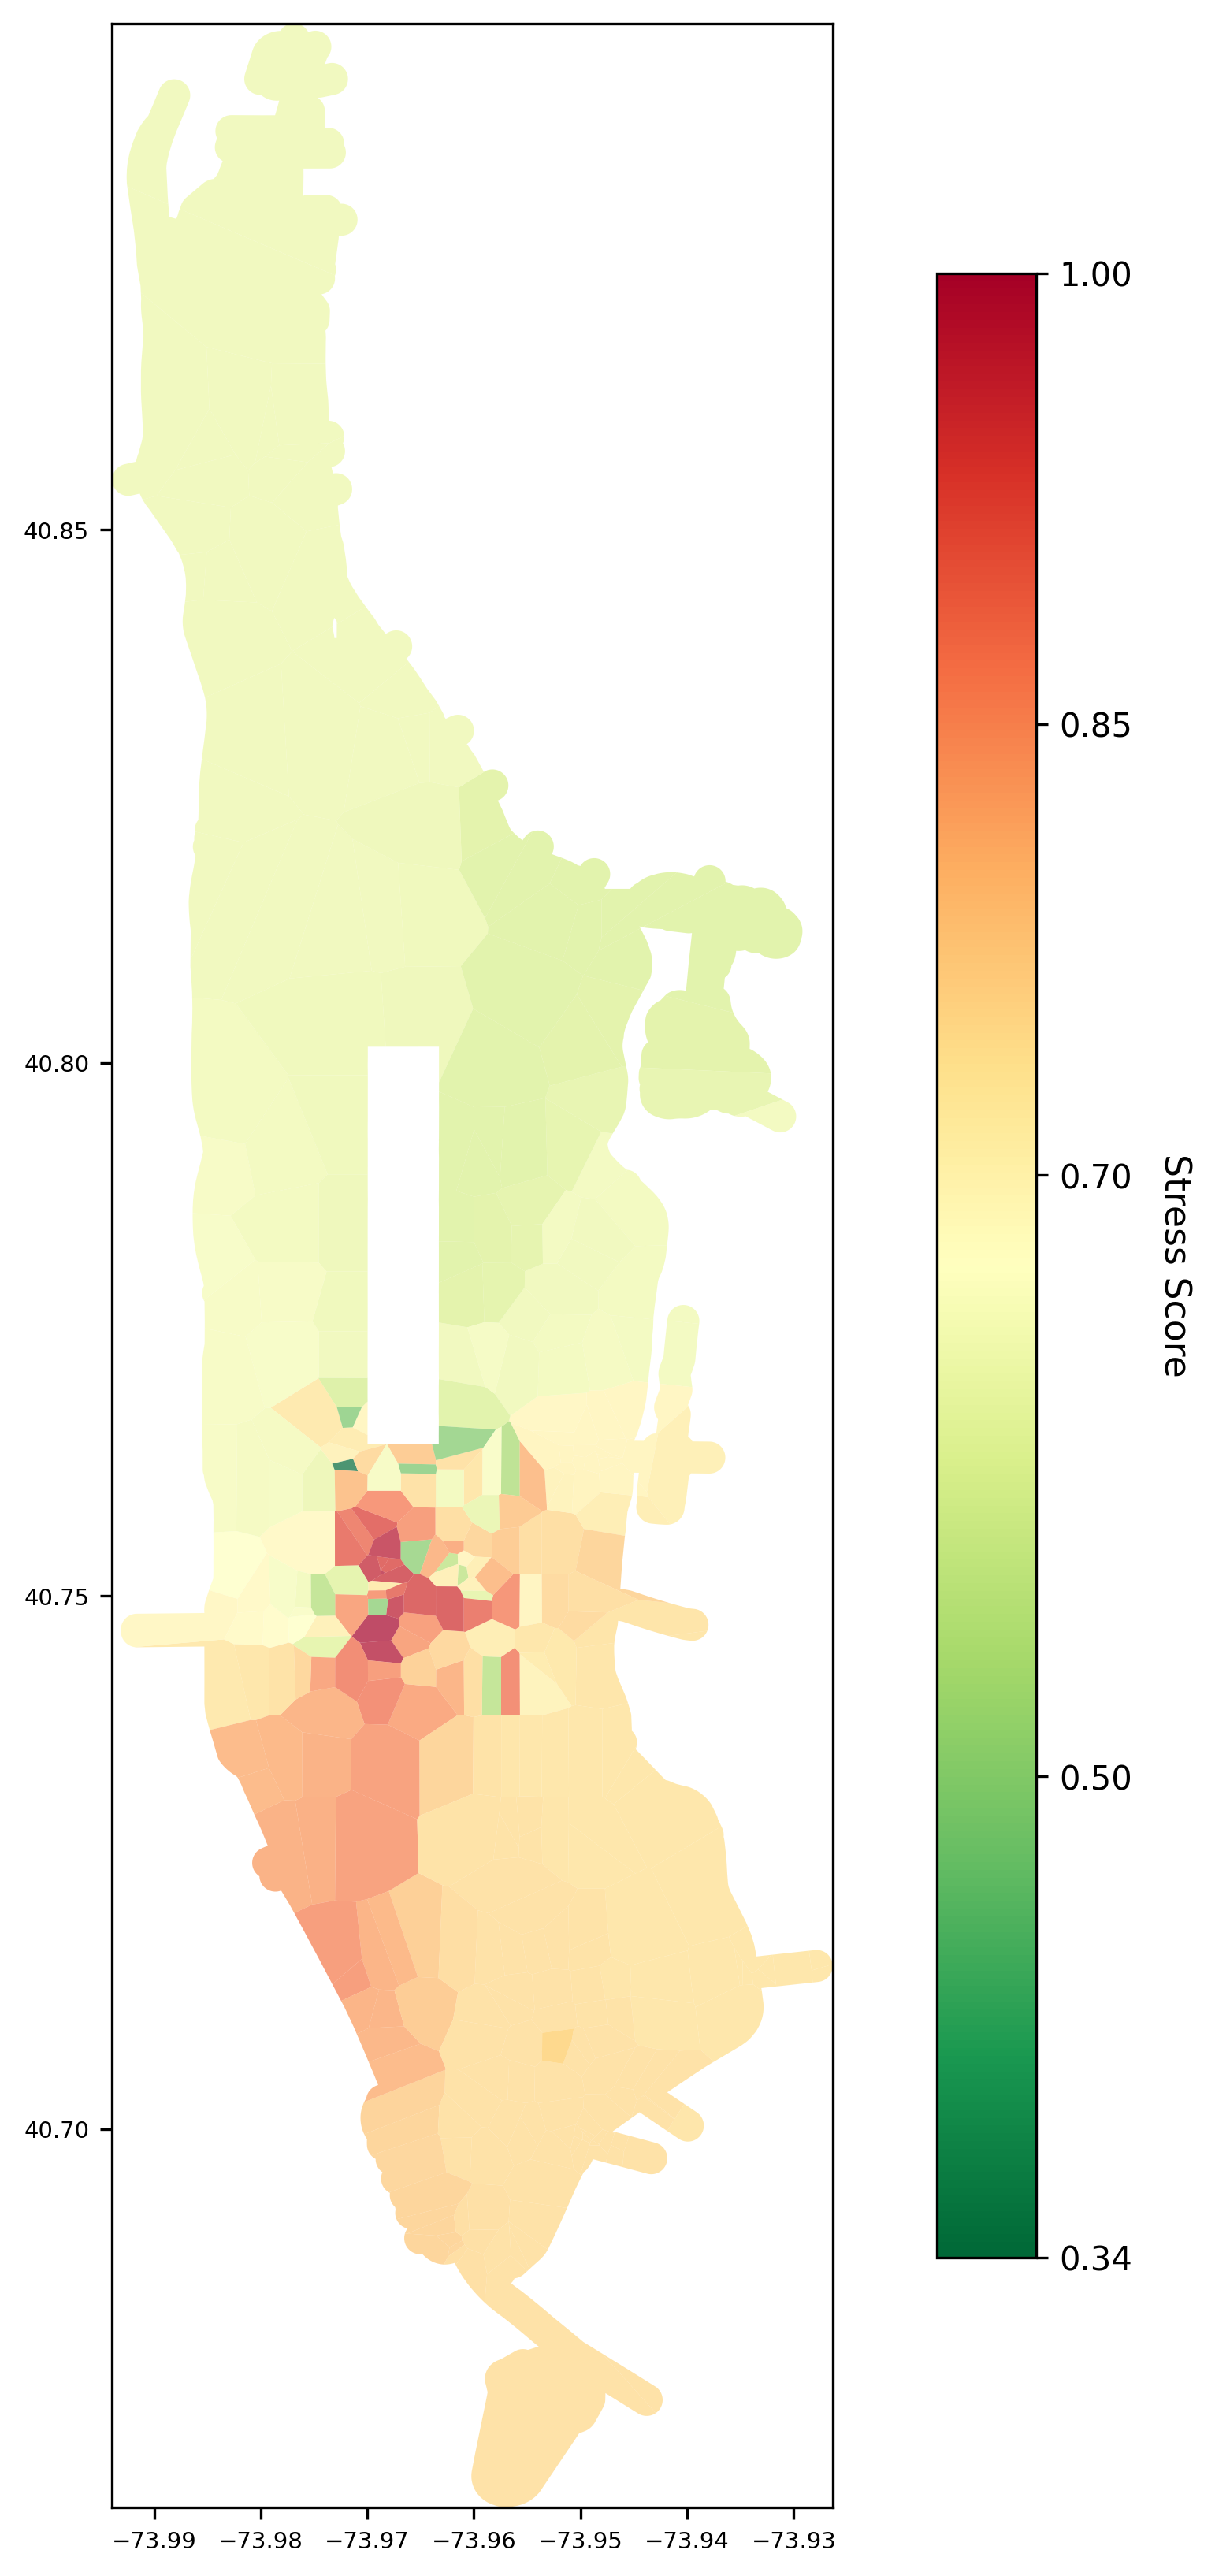
Camera-derived stress field
Decision-locked Voronoi heatmap. Foundation for all routing figures. Stress topology precedes any path algorithm.
§2.2 · Supply
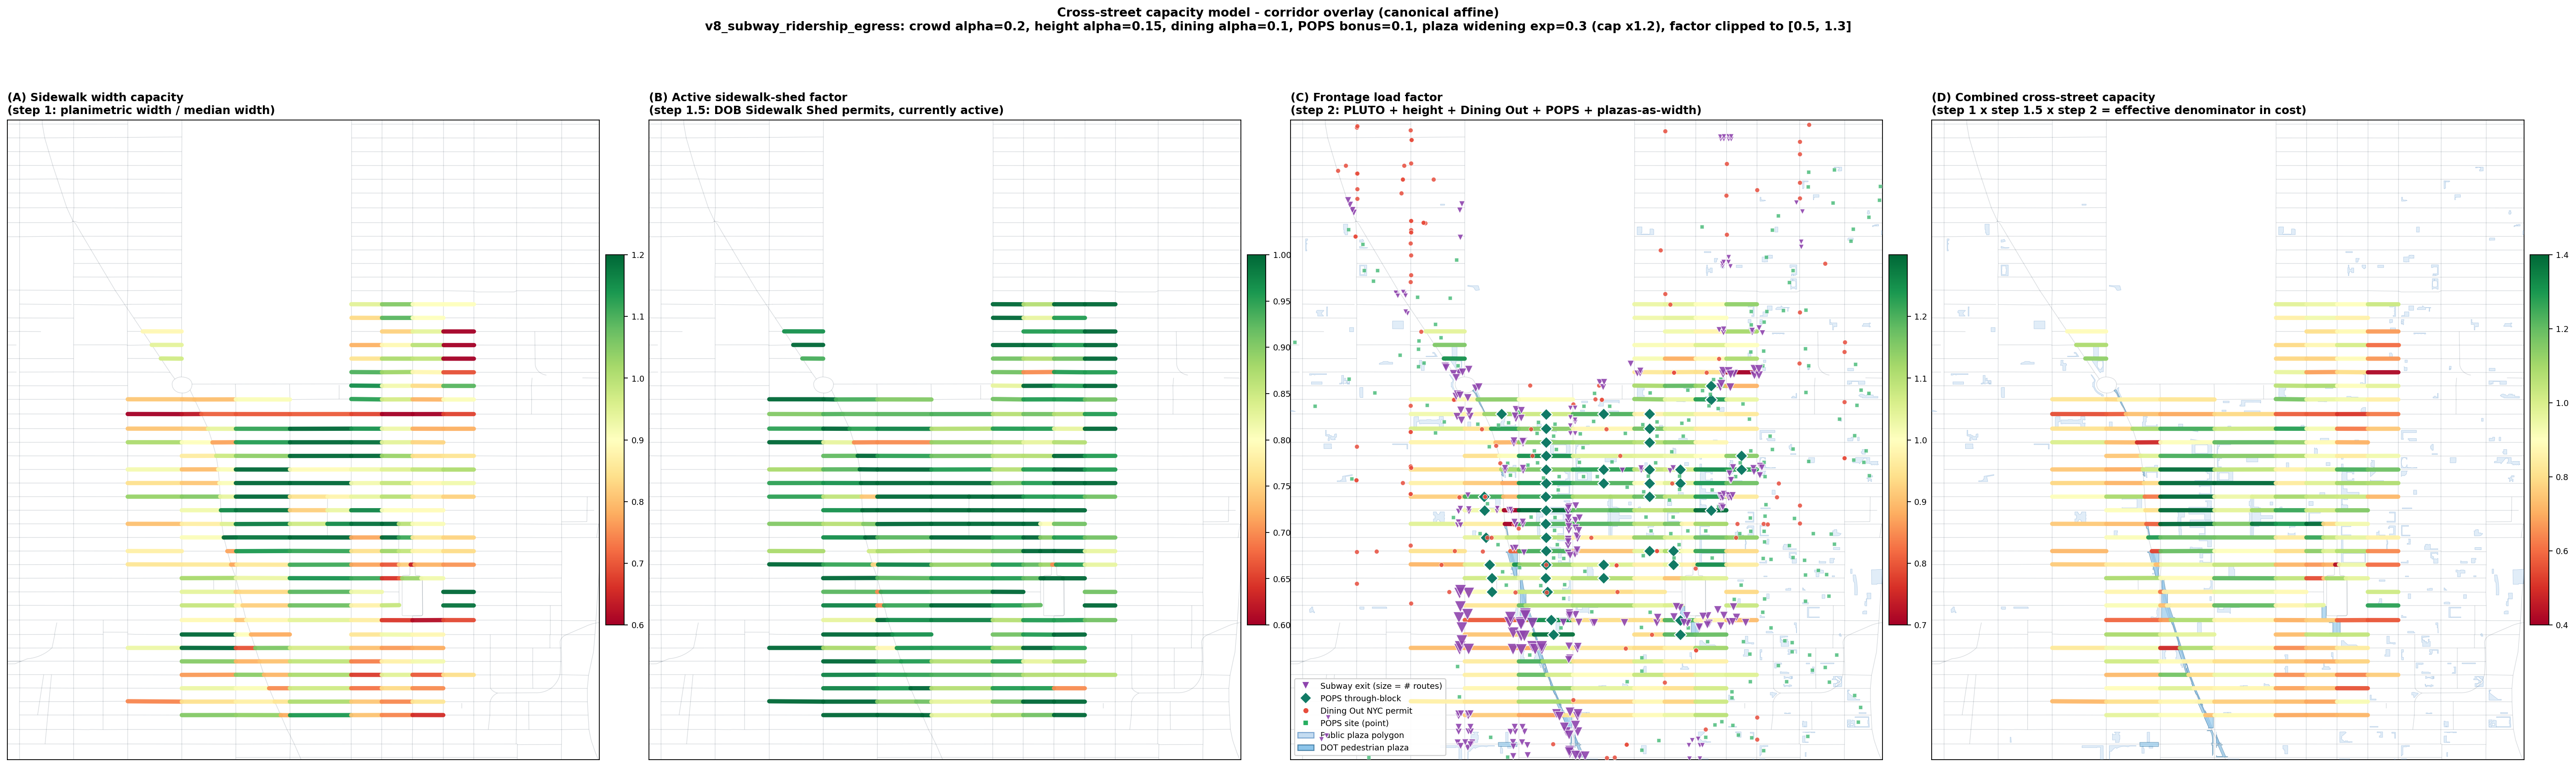
Cross-street capacity
NYC Open Data layers combined on cross-street edges. Supply ⊥ demand (r ≈ 0).
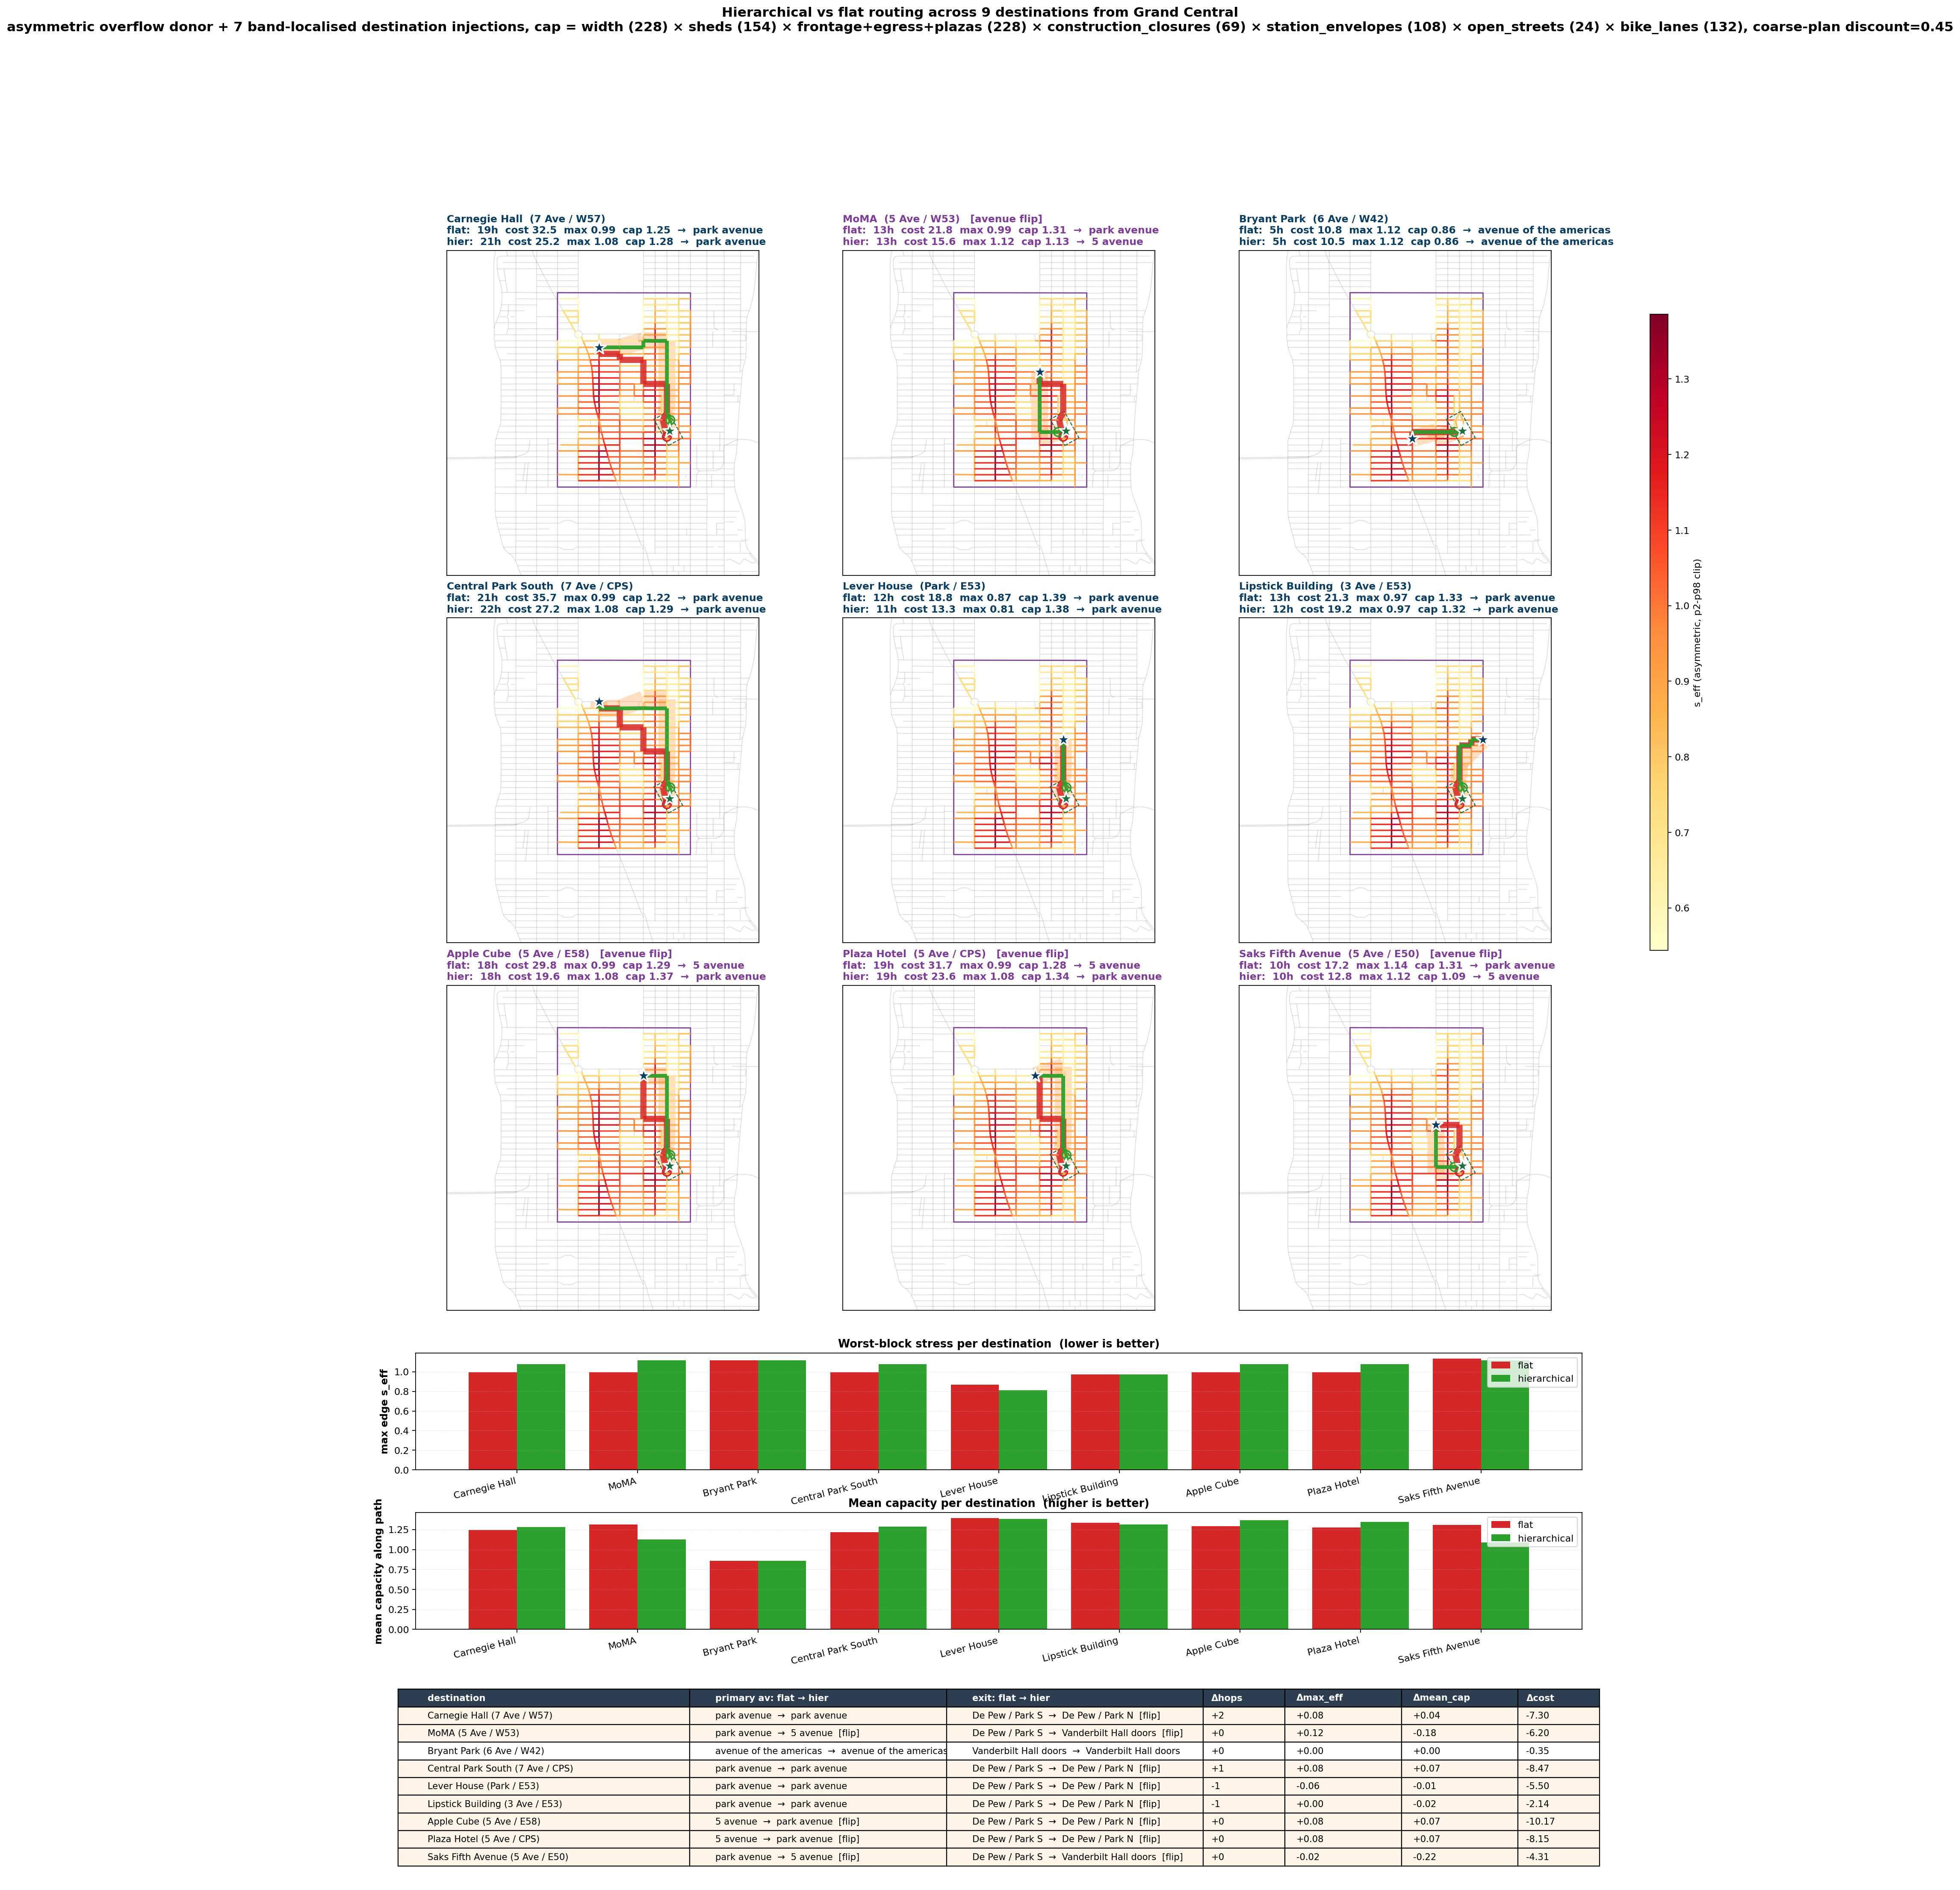
§1.1 · Navigation
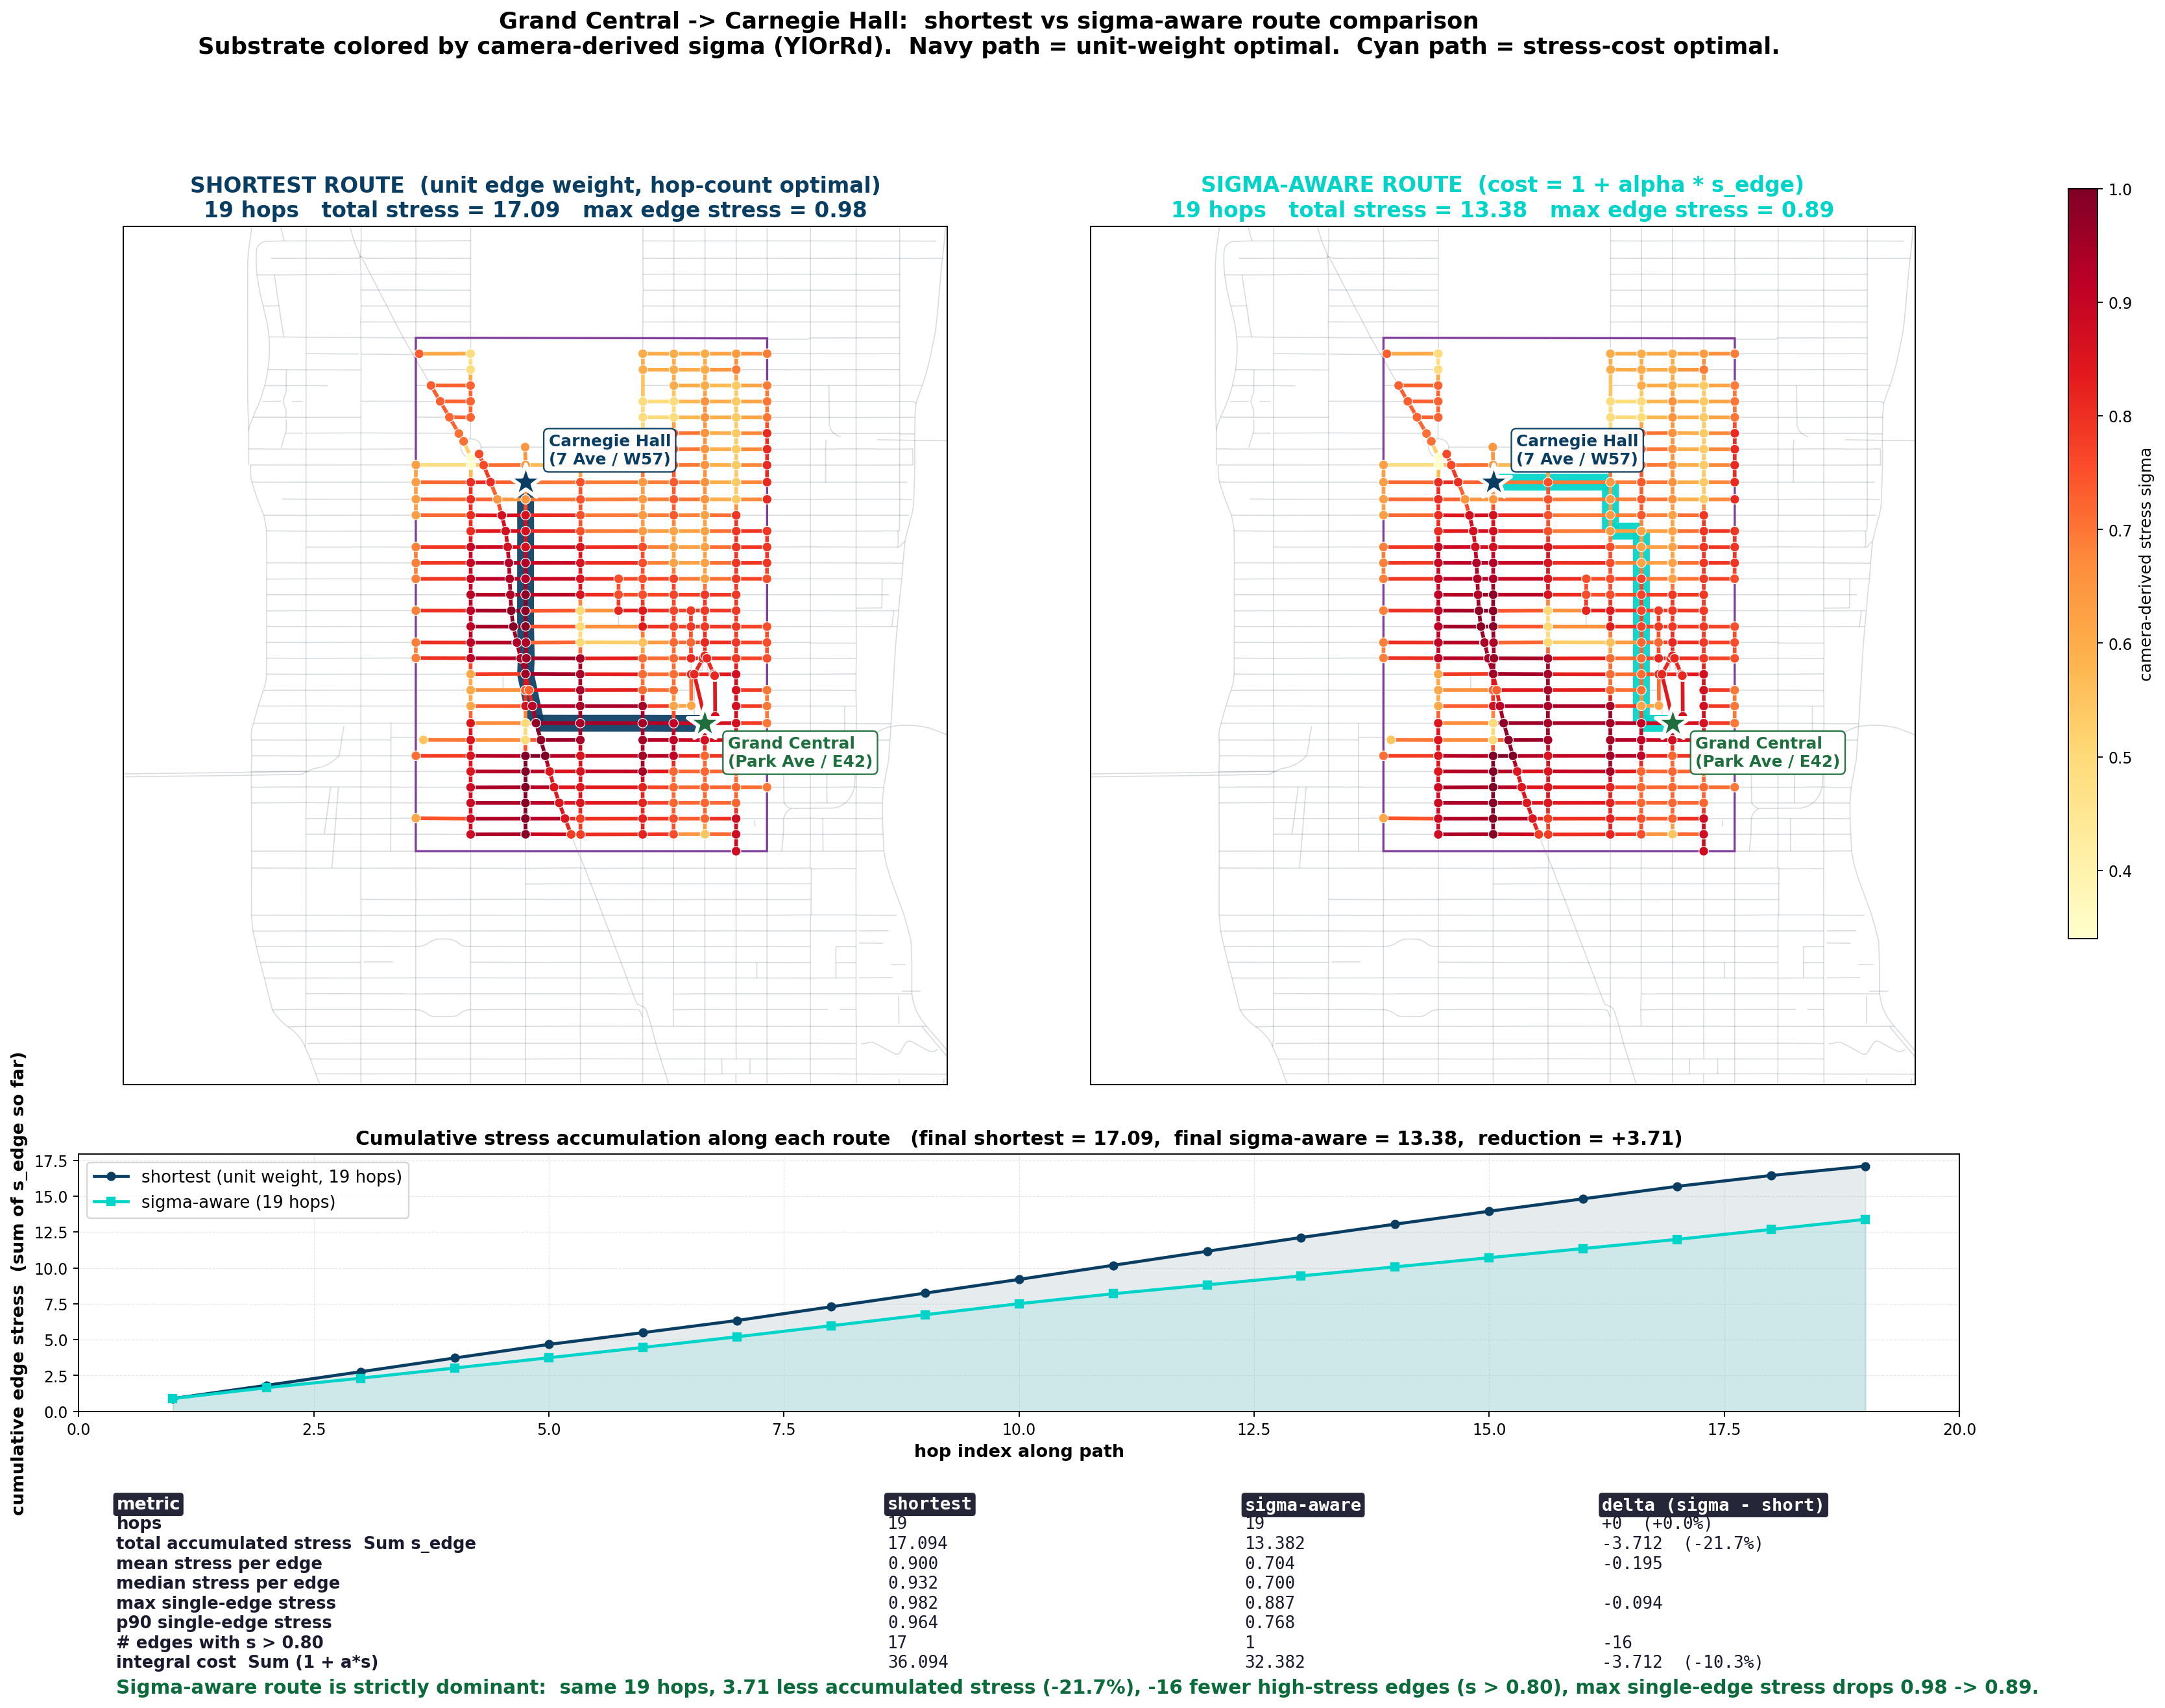
Shortest and stress-aware routes
Same hops, different measured exposure (Grand Central → Carnegie Hall).
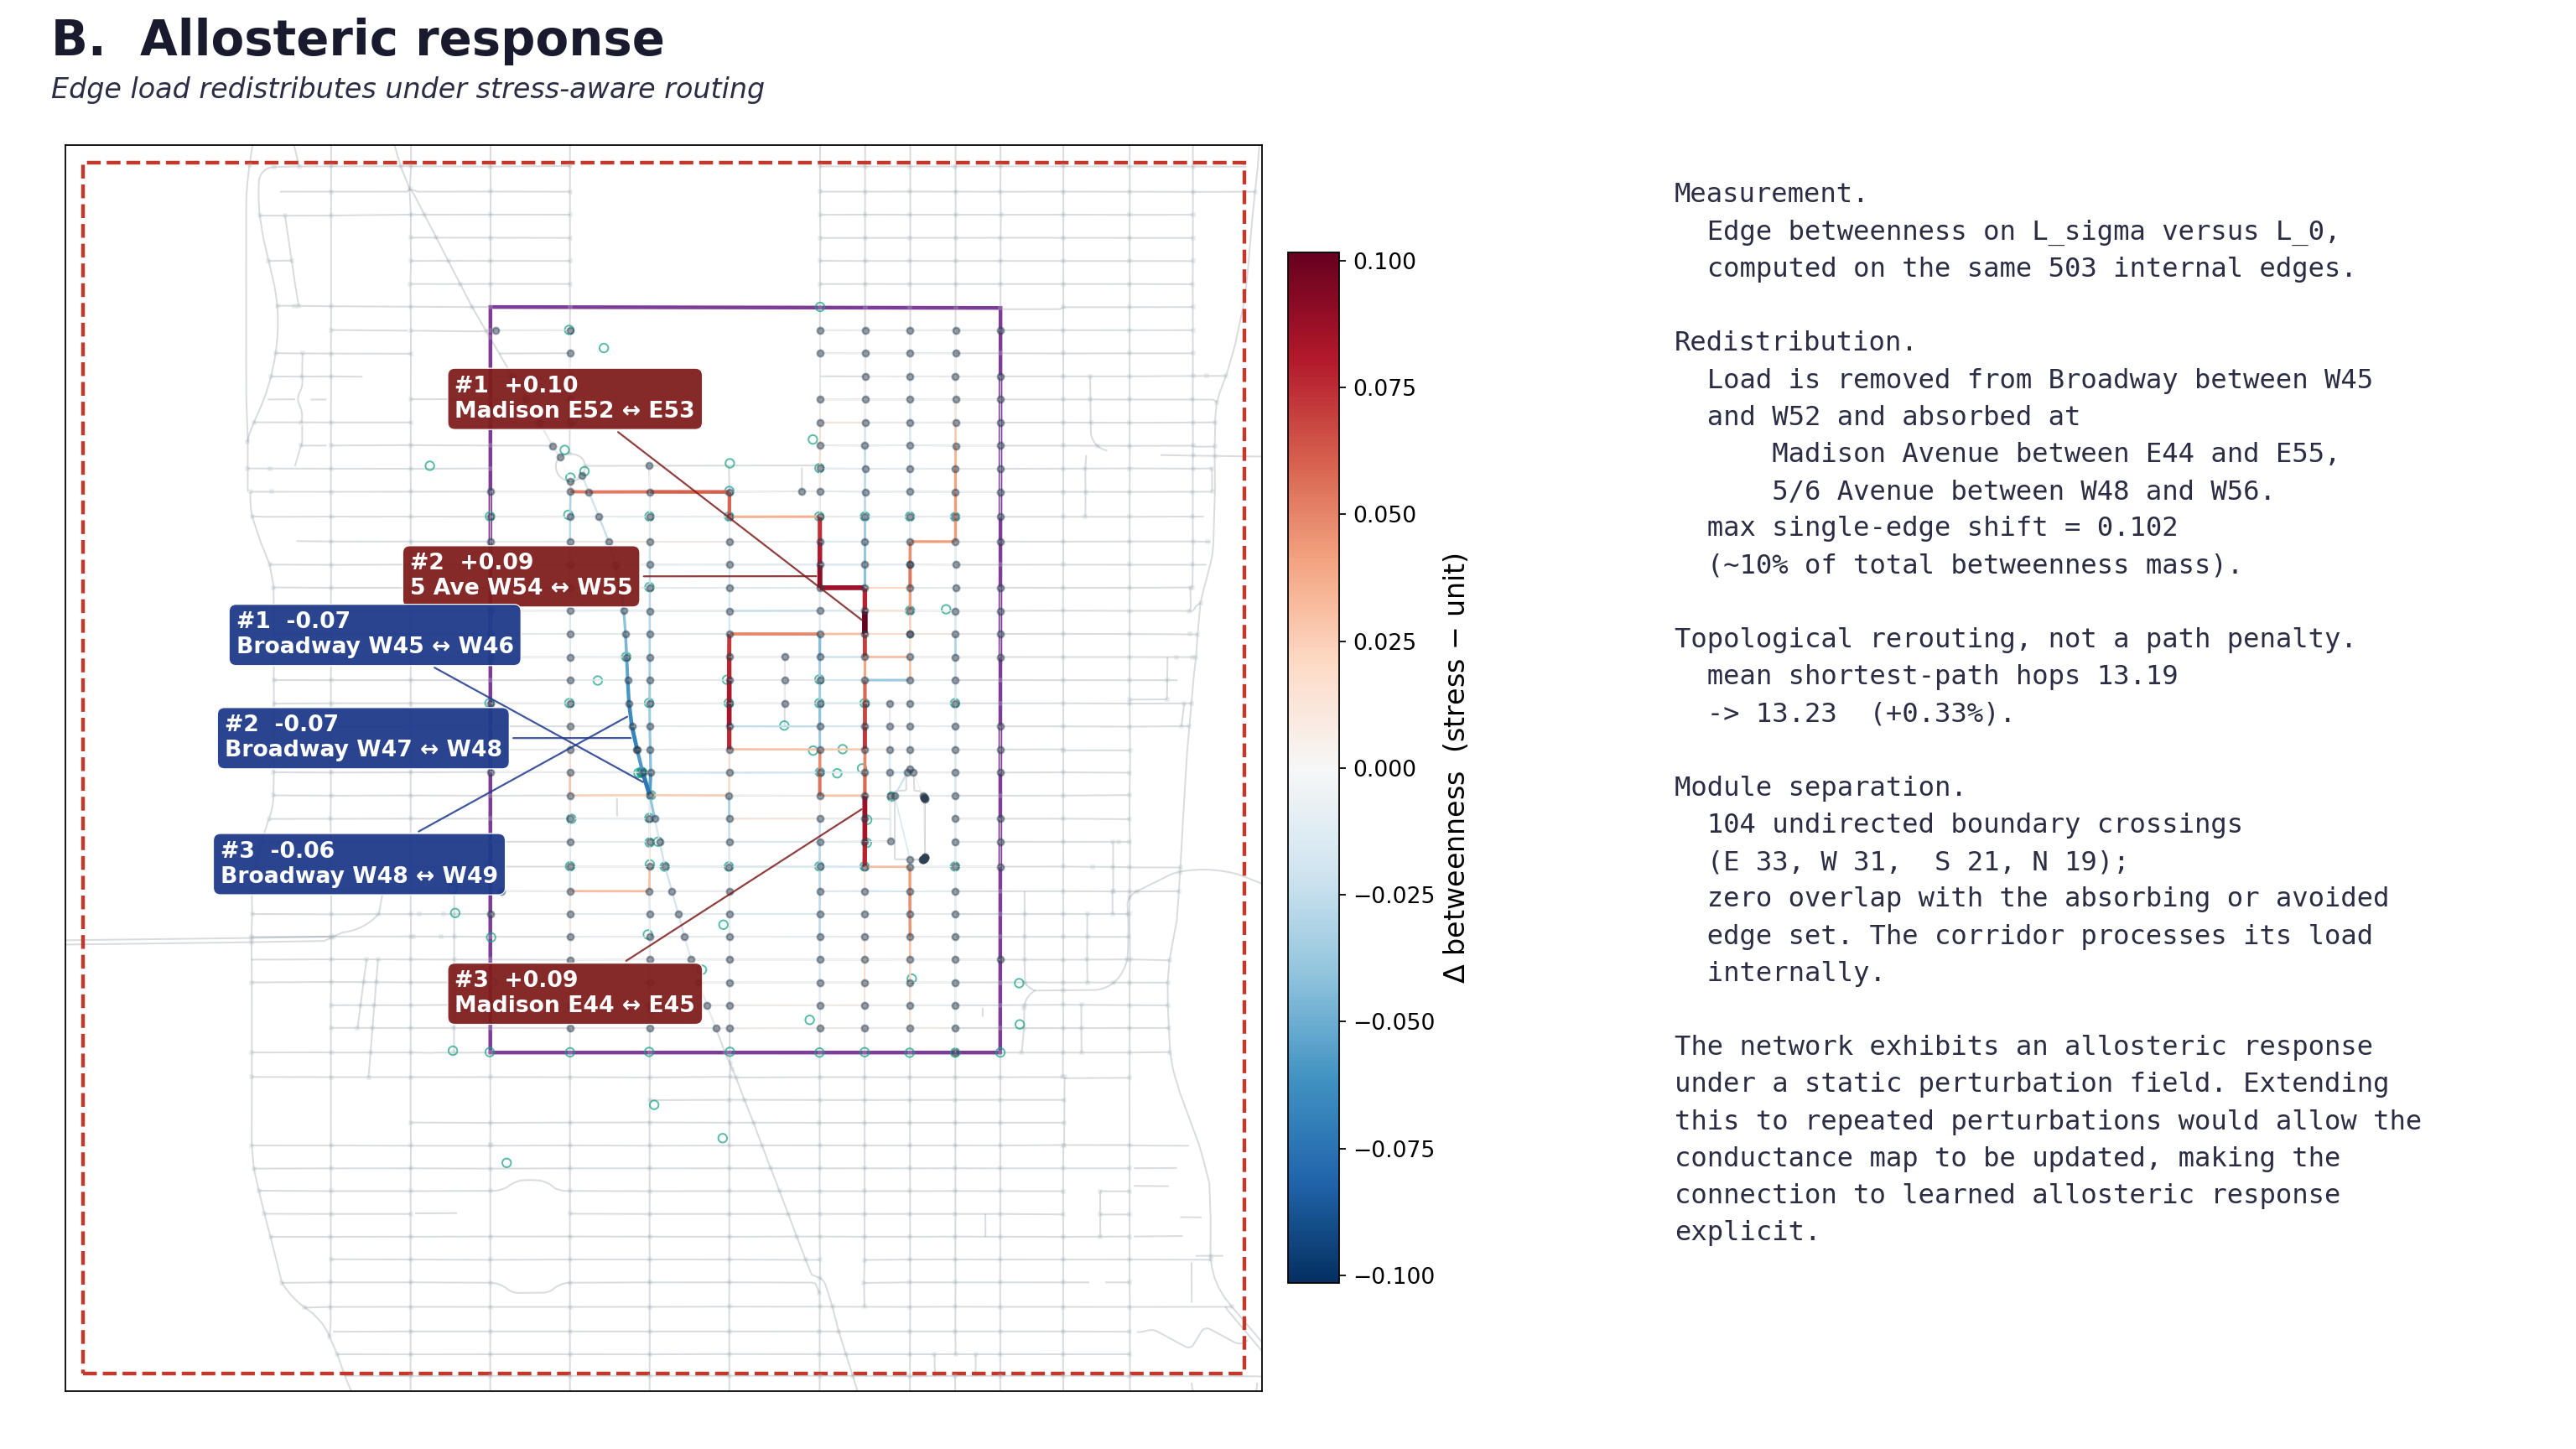
§1.5 · Redistribution
Corridor-wide response
Load shifts under stress-weighted cost across the full corridor graph.
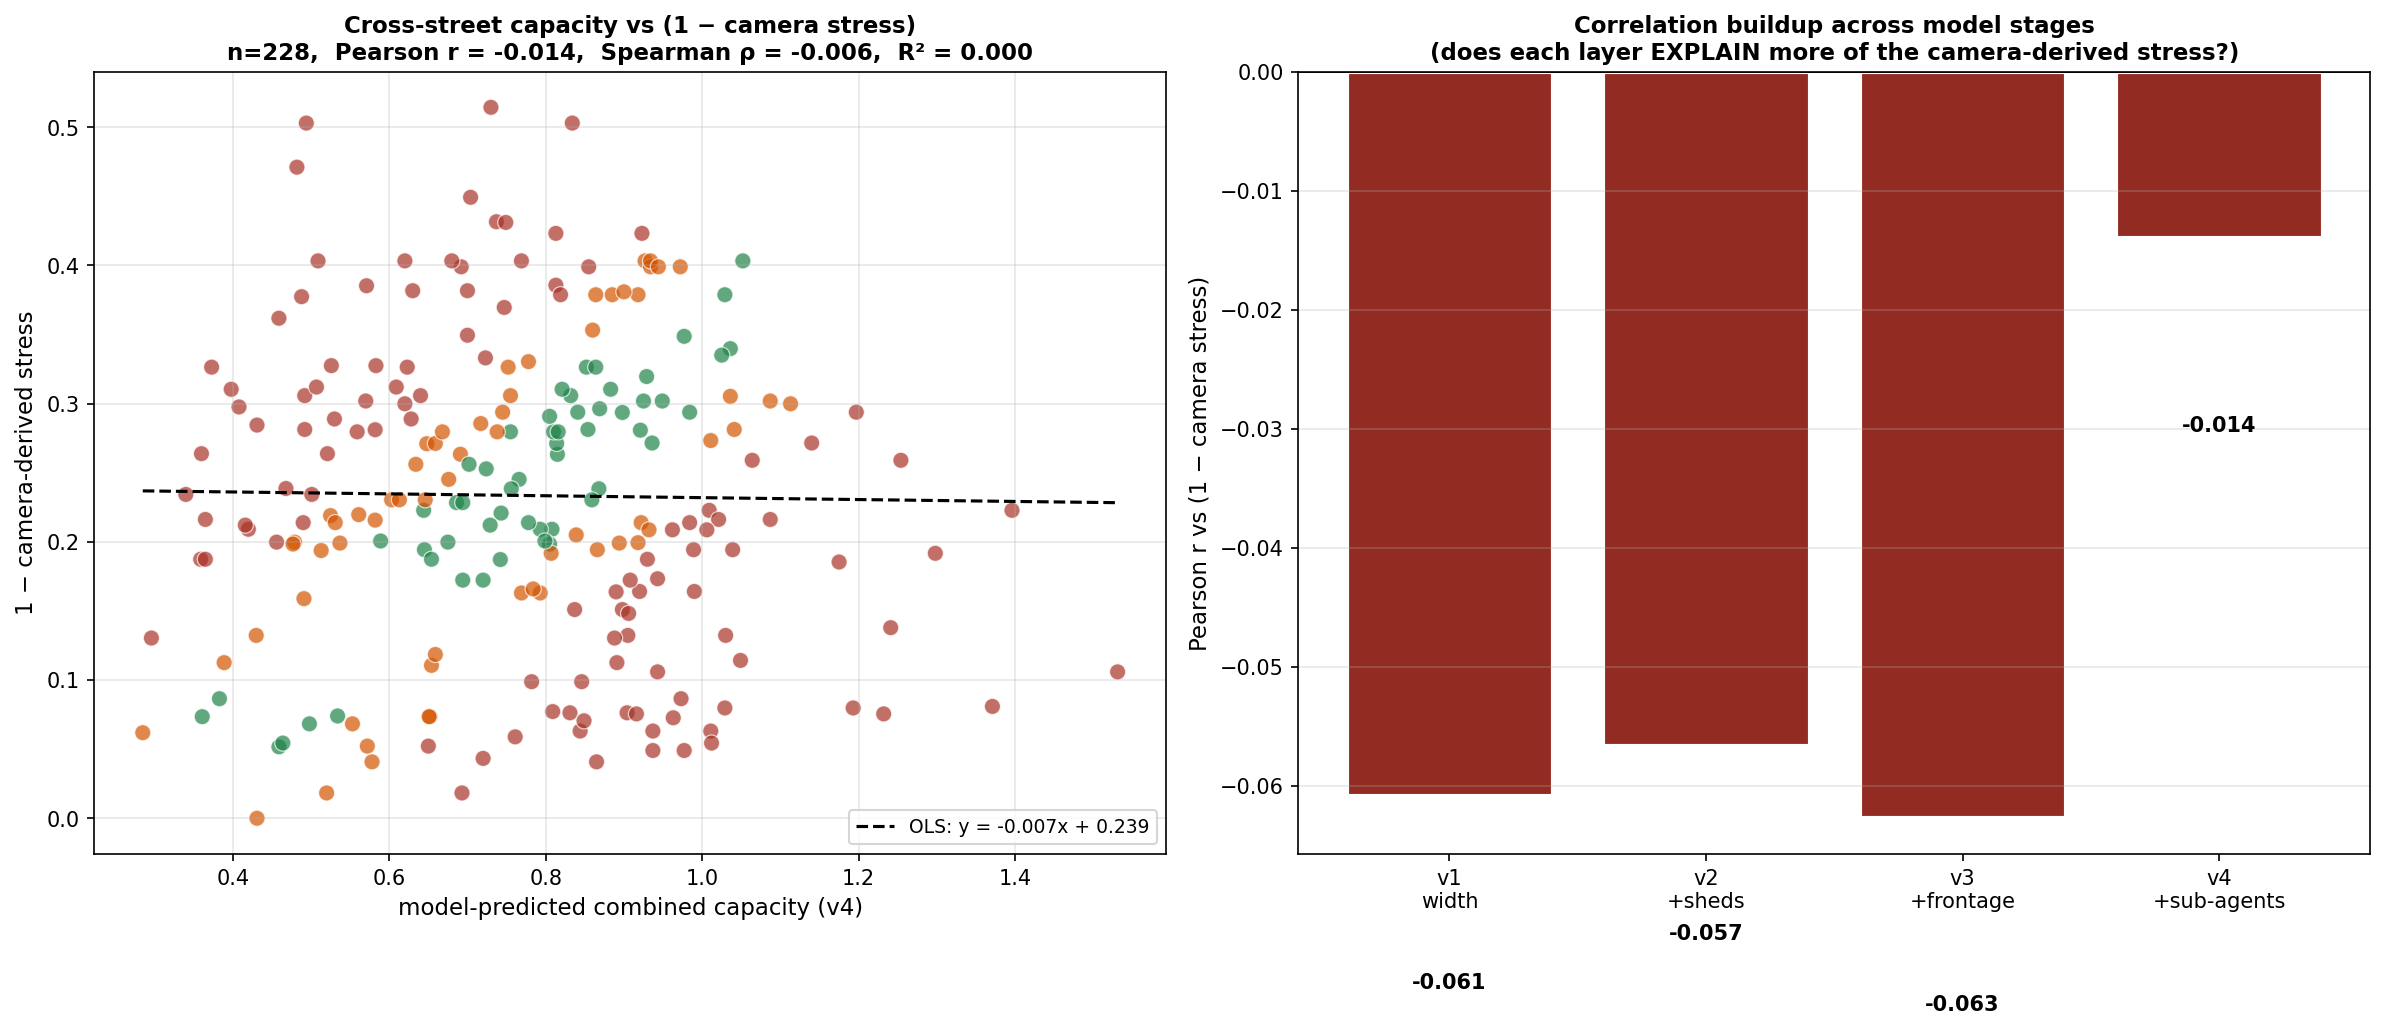
§4 · Validation
Orthogonality check
Supply vs demand scatter. Pearson r ≈ −0.014 on 228 edges.
Close
Go deeper
Narrative framing and discussion questions live on the executive summary deck. Multi-panel figures use full-width slides here and there.