Building the Responsible AI City · NY Tech Week
Choosing how we move between places
aimez · more ways to like the walk
Outcome: how we engage the city between destinations. Shared stress on a public graph, hop-equivalent routes, and room to meet, gather and move the way people prefer.
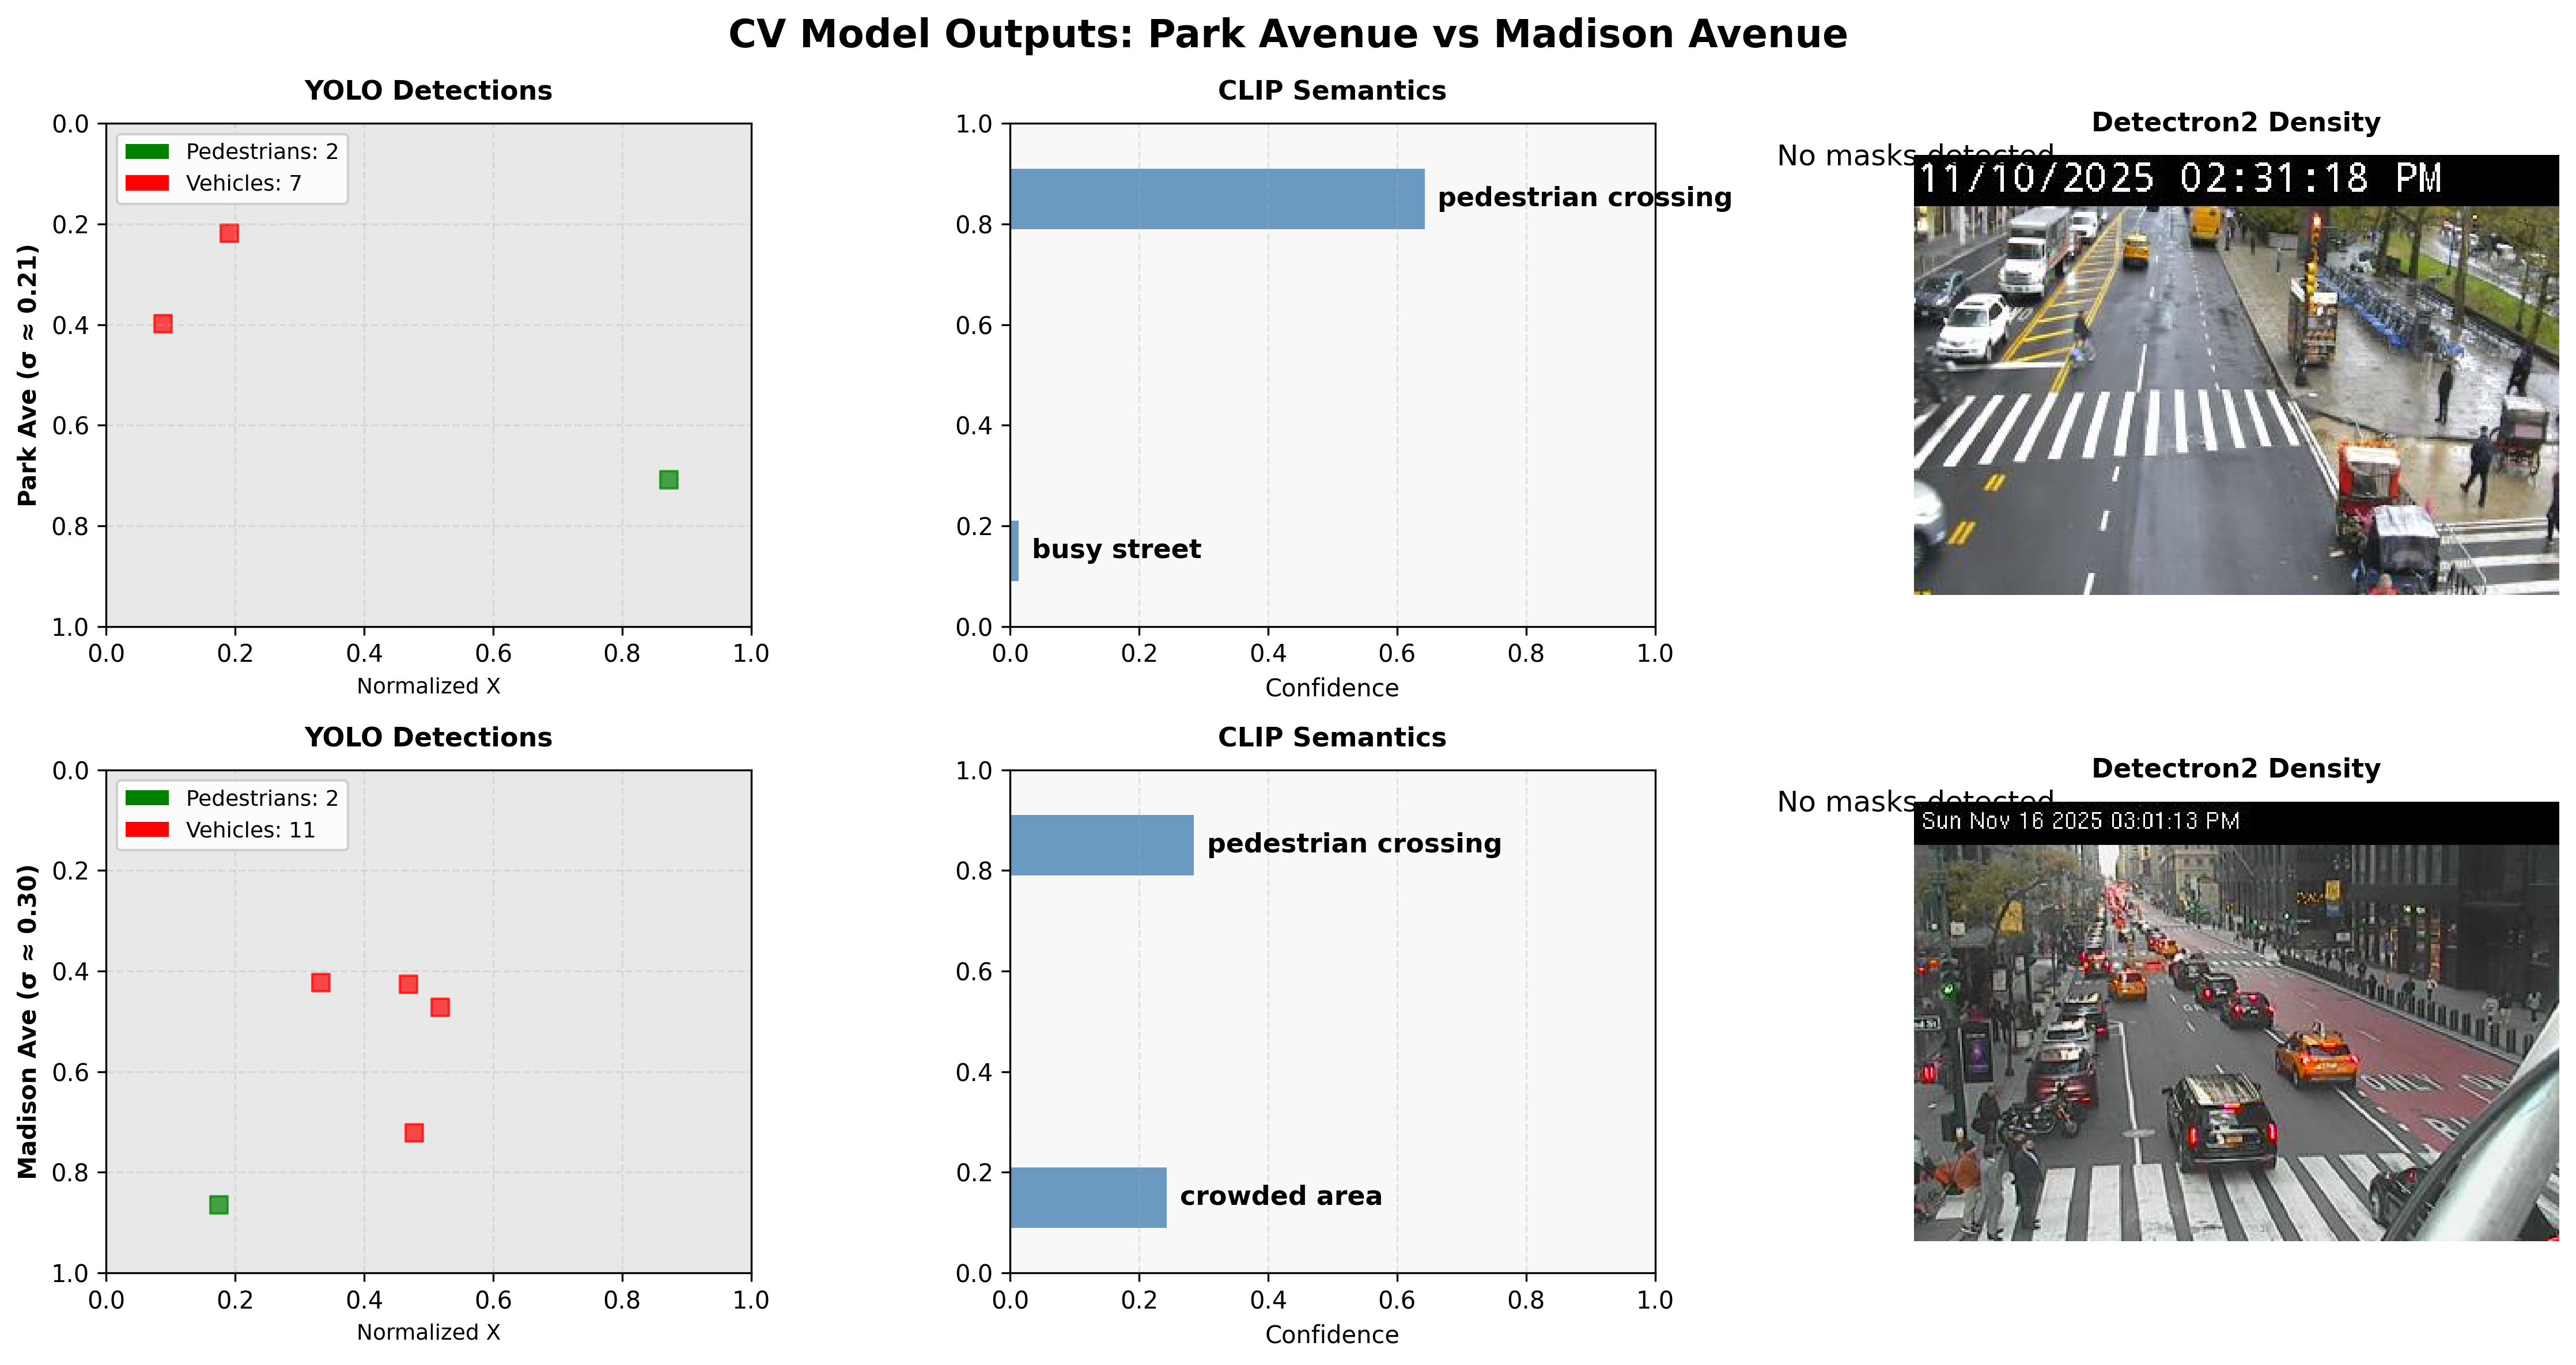
Case study using a vision AI system to reconstruct stress-field topology from DOT camera data and NYC open data on a Manhattan pedestrian graph.
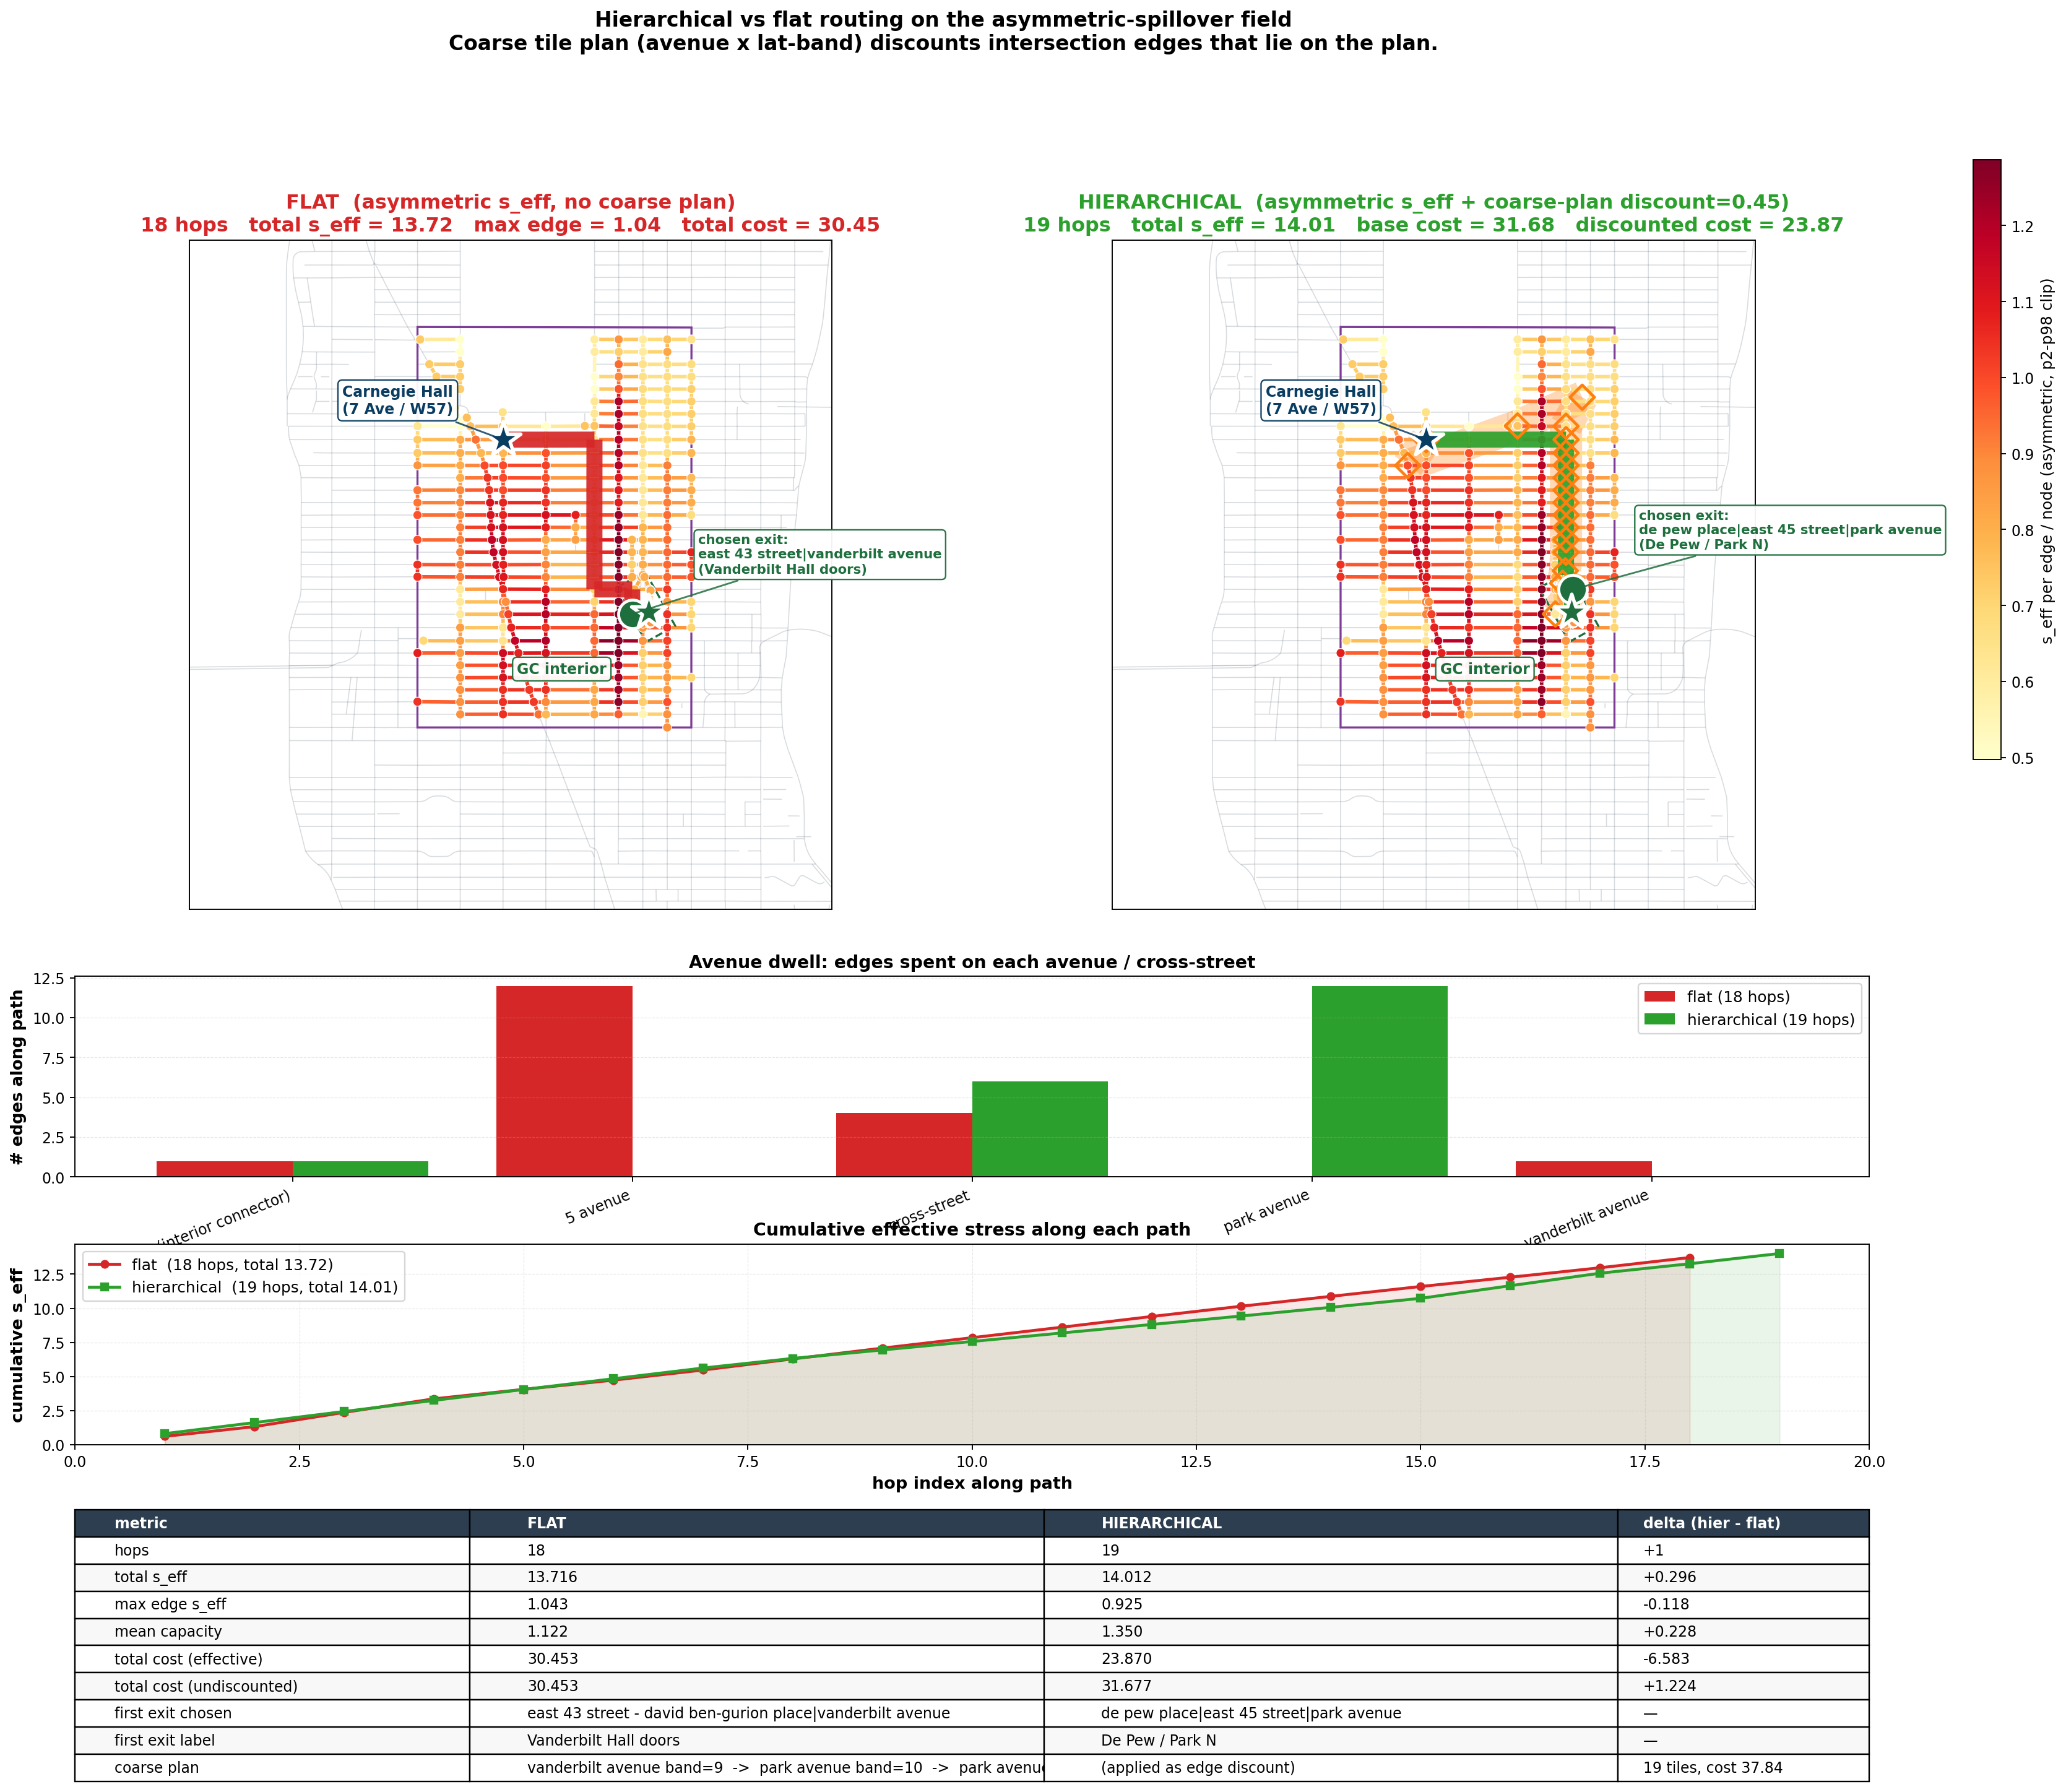
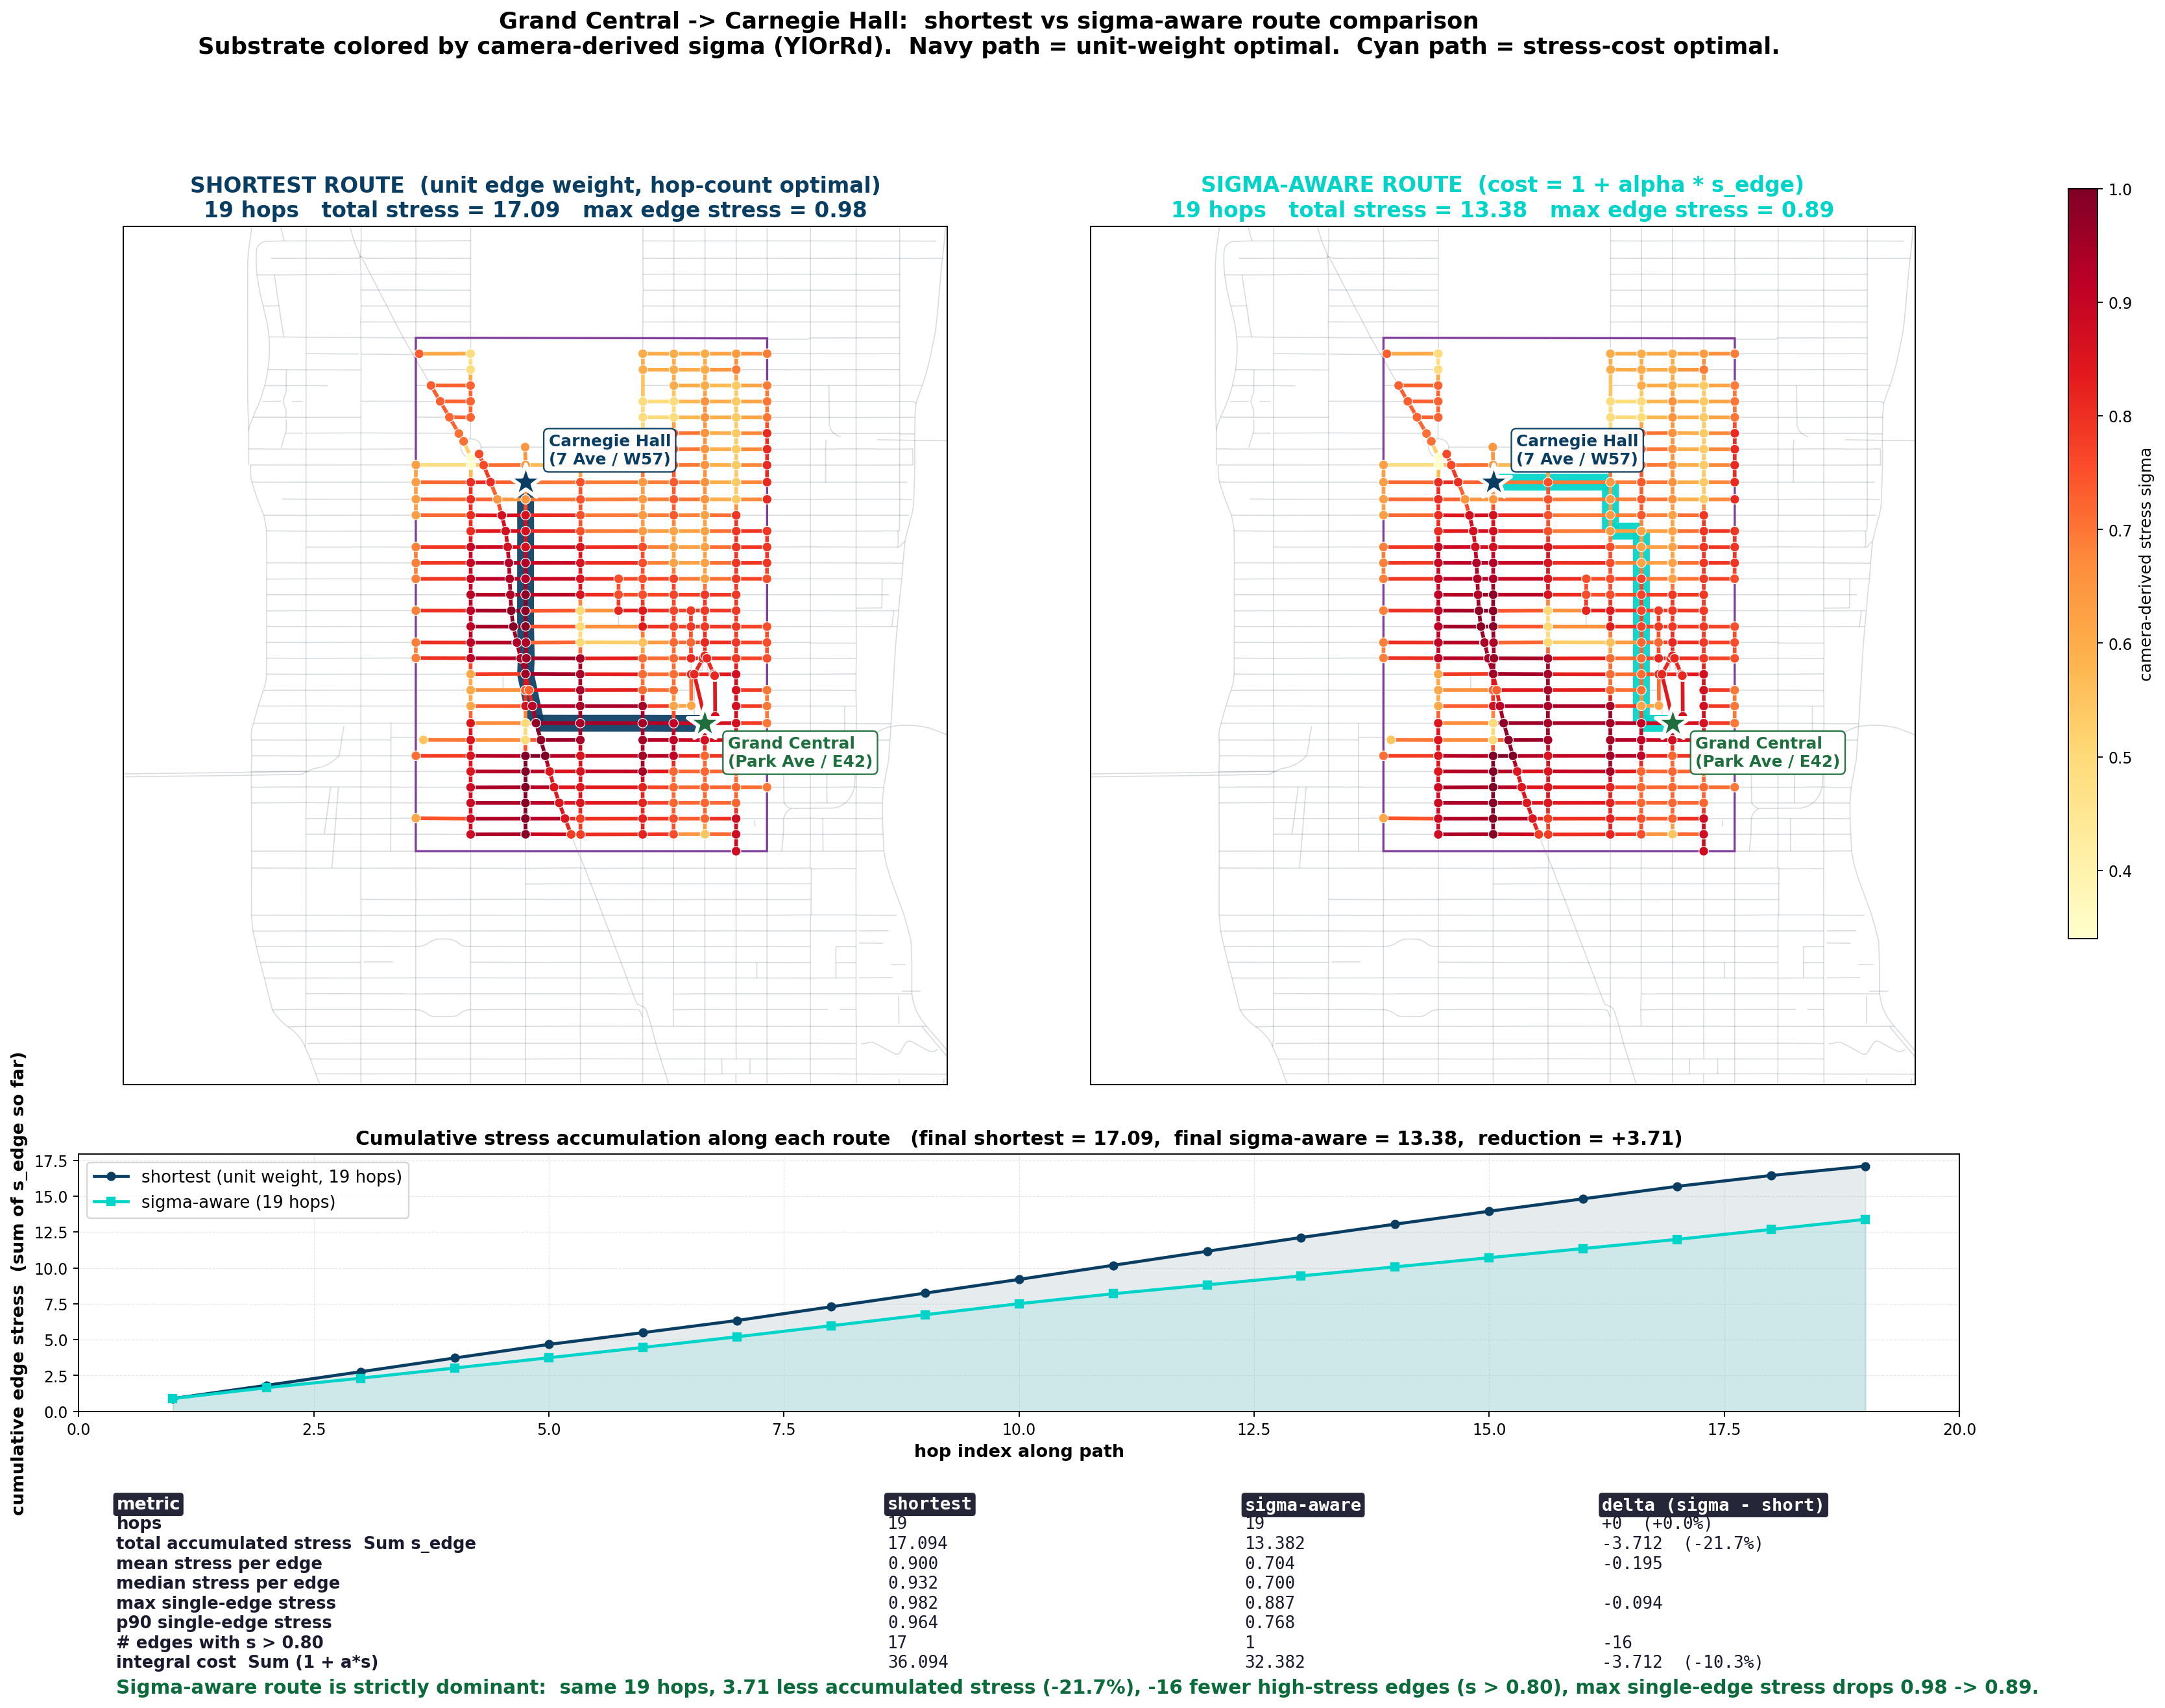
Grand Central → Carnegie Hall: equal hop count; lower accumulated camera stress on the stress-aware path.
Research question
Public-good AI on a measured graph
Can open inputs support psychophysics-informed learning and emergent-behavior models of camera-derived stress topology, then a routing layer that pairs quality-of-life paths with hop-equivalent shortest-path options?
The corridor demonstration is the first worked example: same graph, stress fixed before routing, route pairs compared on measured exposure at equal hop count. The measured graph is public so others can re-run it before any navigation product embeds the model.
Public-good case
What this demonstration claims
- NYC Open Data tables plus DOT traffic cameras (substrate inventory on a later slide).
- Stress topology is fixed before any path algorithm runs.
- Grand Central → Carnegie Hall: same hops, lower accumulated camera stress on the stress-aware path.
- One Manhattan corridor (~300 nodes), reproducible snapshot, corridor-scale claims only.
- Open tables stay open; fusion, calibration, and routing cost stay proprietary.
Discussion
Questions the program invites
Governance
What evidence is enough before this model ships inside a consumer routing product?
Geospatial platform
Is the corridor graph a product layer, an open reference, or a research instrument, and who updates it when streets change?
Agency pilot
What does a reproducible Manhattan corridor pilot look like as refresh cadence, sign-off and documented process?
Funders
What gets funded that stays public-good, corridor-bounded and reproducible?
Workforce
Can students and agencies re-run the same graph snapshot, and who maintains the graph when the city changes?
Program
One graph, four coupled layers
- Stress field. DOT cameras mapped to edge stress on the pedestrian graph.
- Topology. Paths, loops and residuals on the locked corridor graph.
- Forecasting. Short-horizon updates to the stress field before routing runs.
- Route solving. Hop-equivalent and stress-aware paths on the same directed graph.
Built from NYC open data on a Manhattan corridor graph (40th–59th St, Lexington to 8th Ave, ~300 nodes). Four layers on one locked graph keep stress, topology, forecast, and routing inspectable in that order.
Multi-panel figure
Open tables through fusion to routing
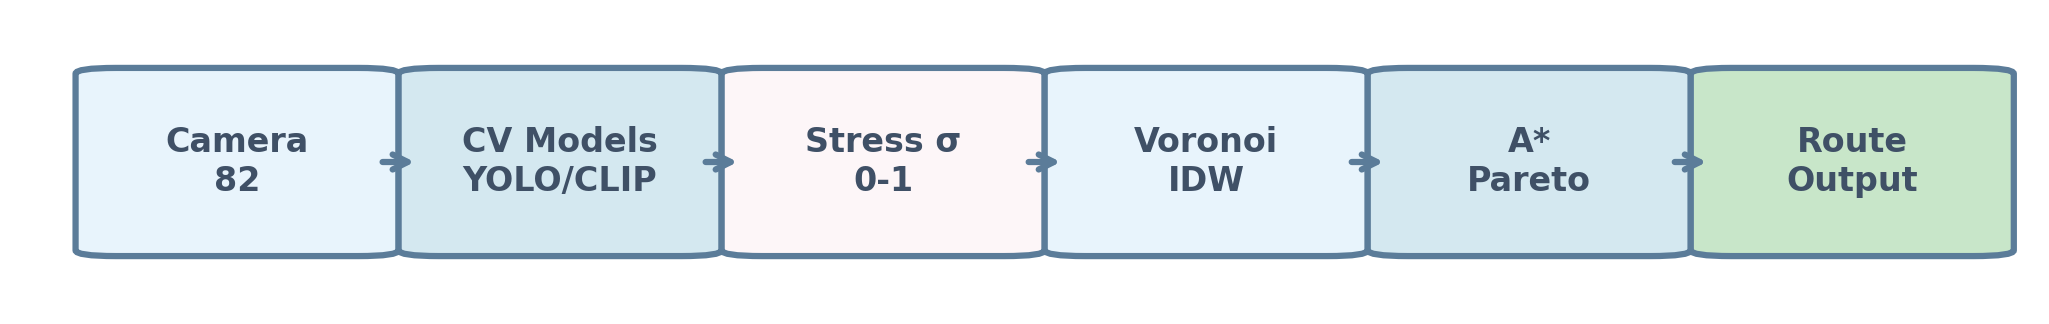
Public NYC tables and DOT cameras feed a decision-locked stress field; proprietary fusion and calibration sit between open inputs and the routing demo.
Substrate
NYC open data and public feeds
| Source | Role |
|---|---|
| Graph | Digital City Map centerlines |
| Demand | DOT traffic cameras → stress field |
| Supply | DCP sidewalks, PLUTO, POPS, footprints |
| Supply | DOB sheds · DOT streets, closures, bikes, plazas |
| Supply | MTA stations, ridership, elevators |
| Supply | Dining / street-use permits |
Proprietary layer: fusion, calibration, routing cost. Tables listed here are open.
Problem
Map distance and walking burden diverge
Apps optimize hops or minutes. Walkers meet crowding, sheds, station egress and uneven capacity. Local pressure sits on the graph where standard routers use hop count alone.
The program puts that pressure on a graph and compares routes on measured exposure from the stress field, including the walk between destinations that hop-minimum routers rarely surface.
Pilot
Manhattan corridor (40th–59th St)
Lexington to 8th Ave · ~300 nodes · decision-locked stress field · multi-layer capacity from NYC Open Data.
Same graph, varying fields. One reproducible corridor snapshot at a time: evidence at corridor scale before any city-wide rollout.
Methods
Three streams → one substrate
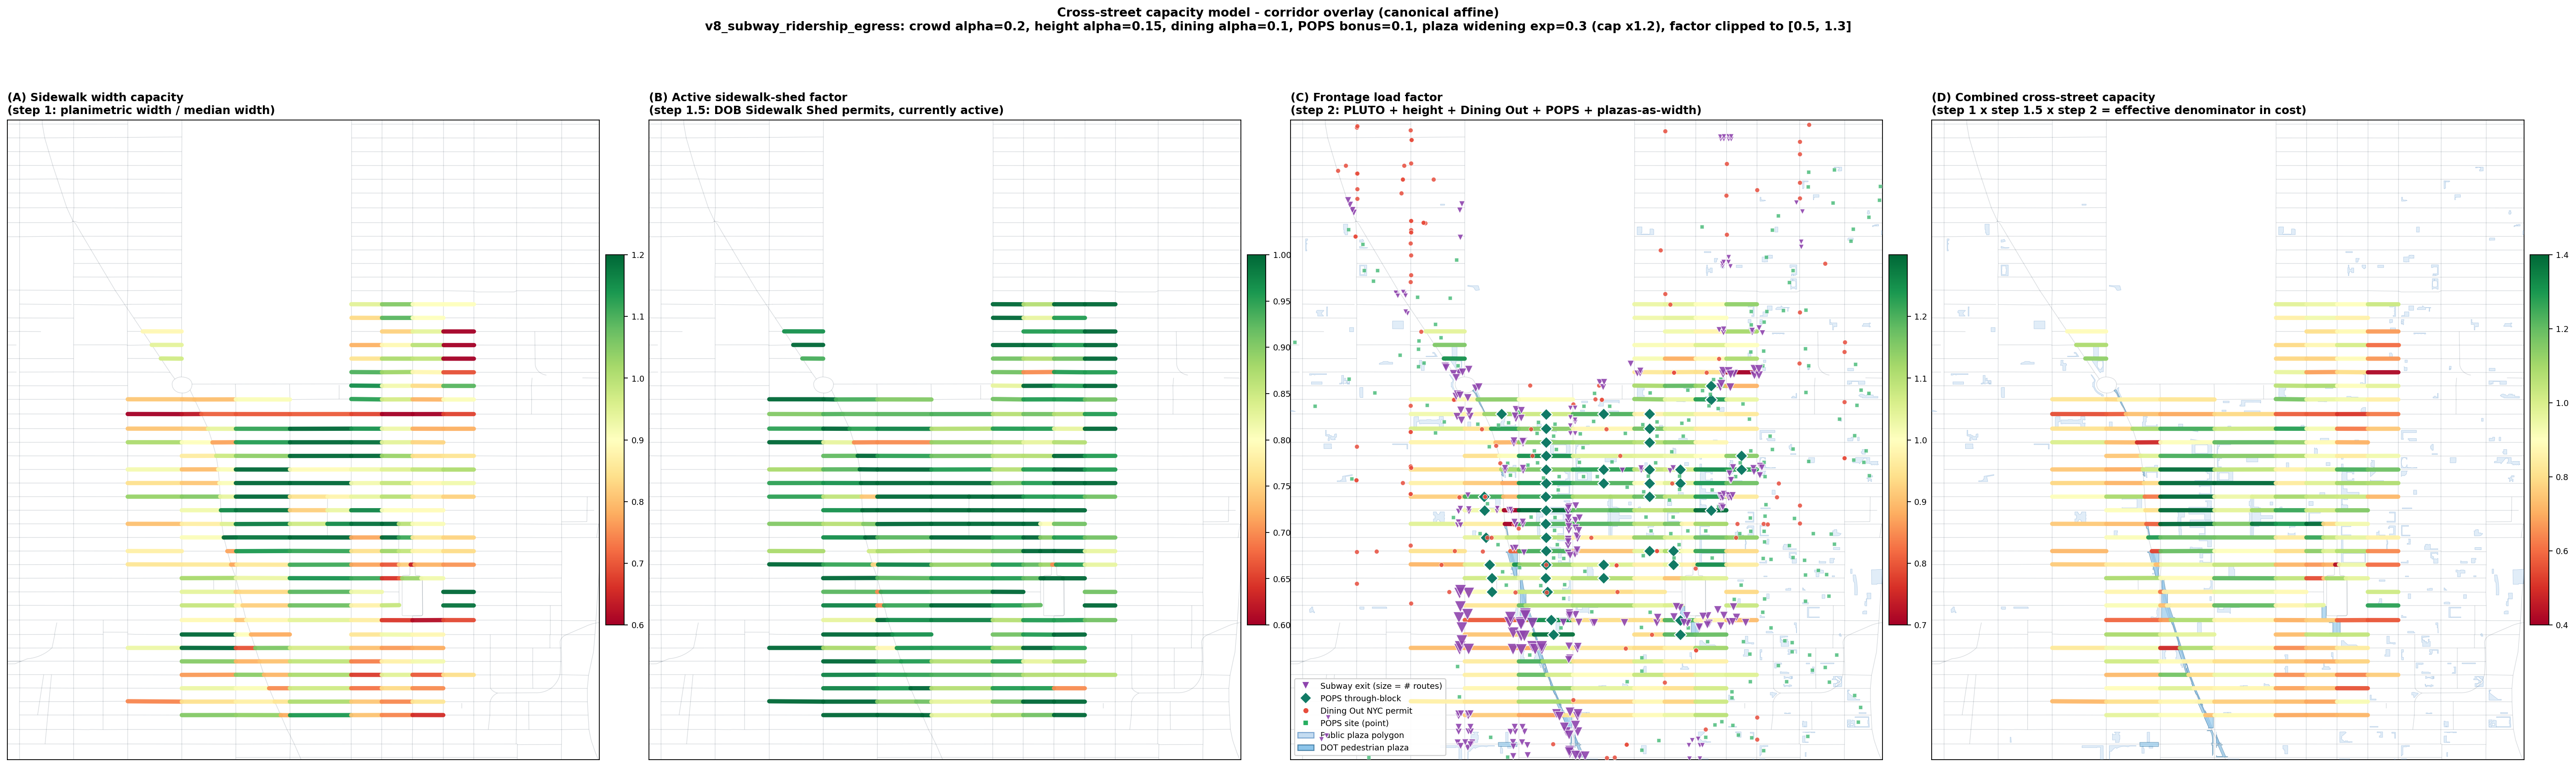
- Open civic data. Supply-side capacity on cross-street edges.
- Public camera sensing. Demand-side stress on the graph.
- Field calibration. Lived-knowledge audit on reference blocks.
Stress topology is read before routing is switched on.
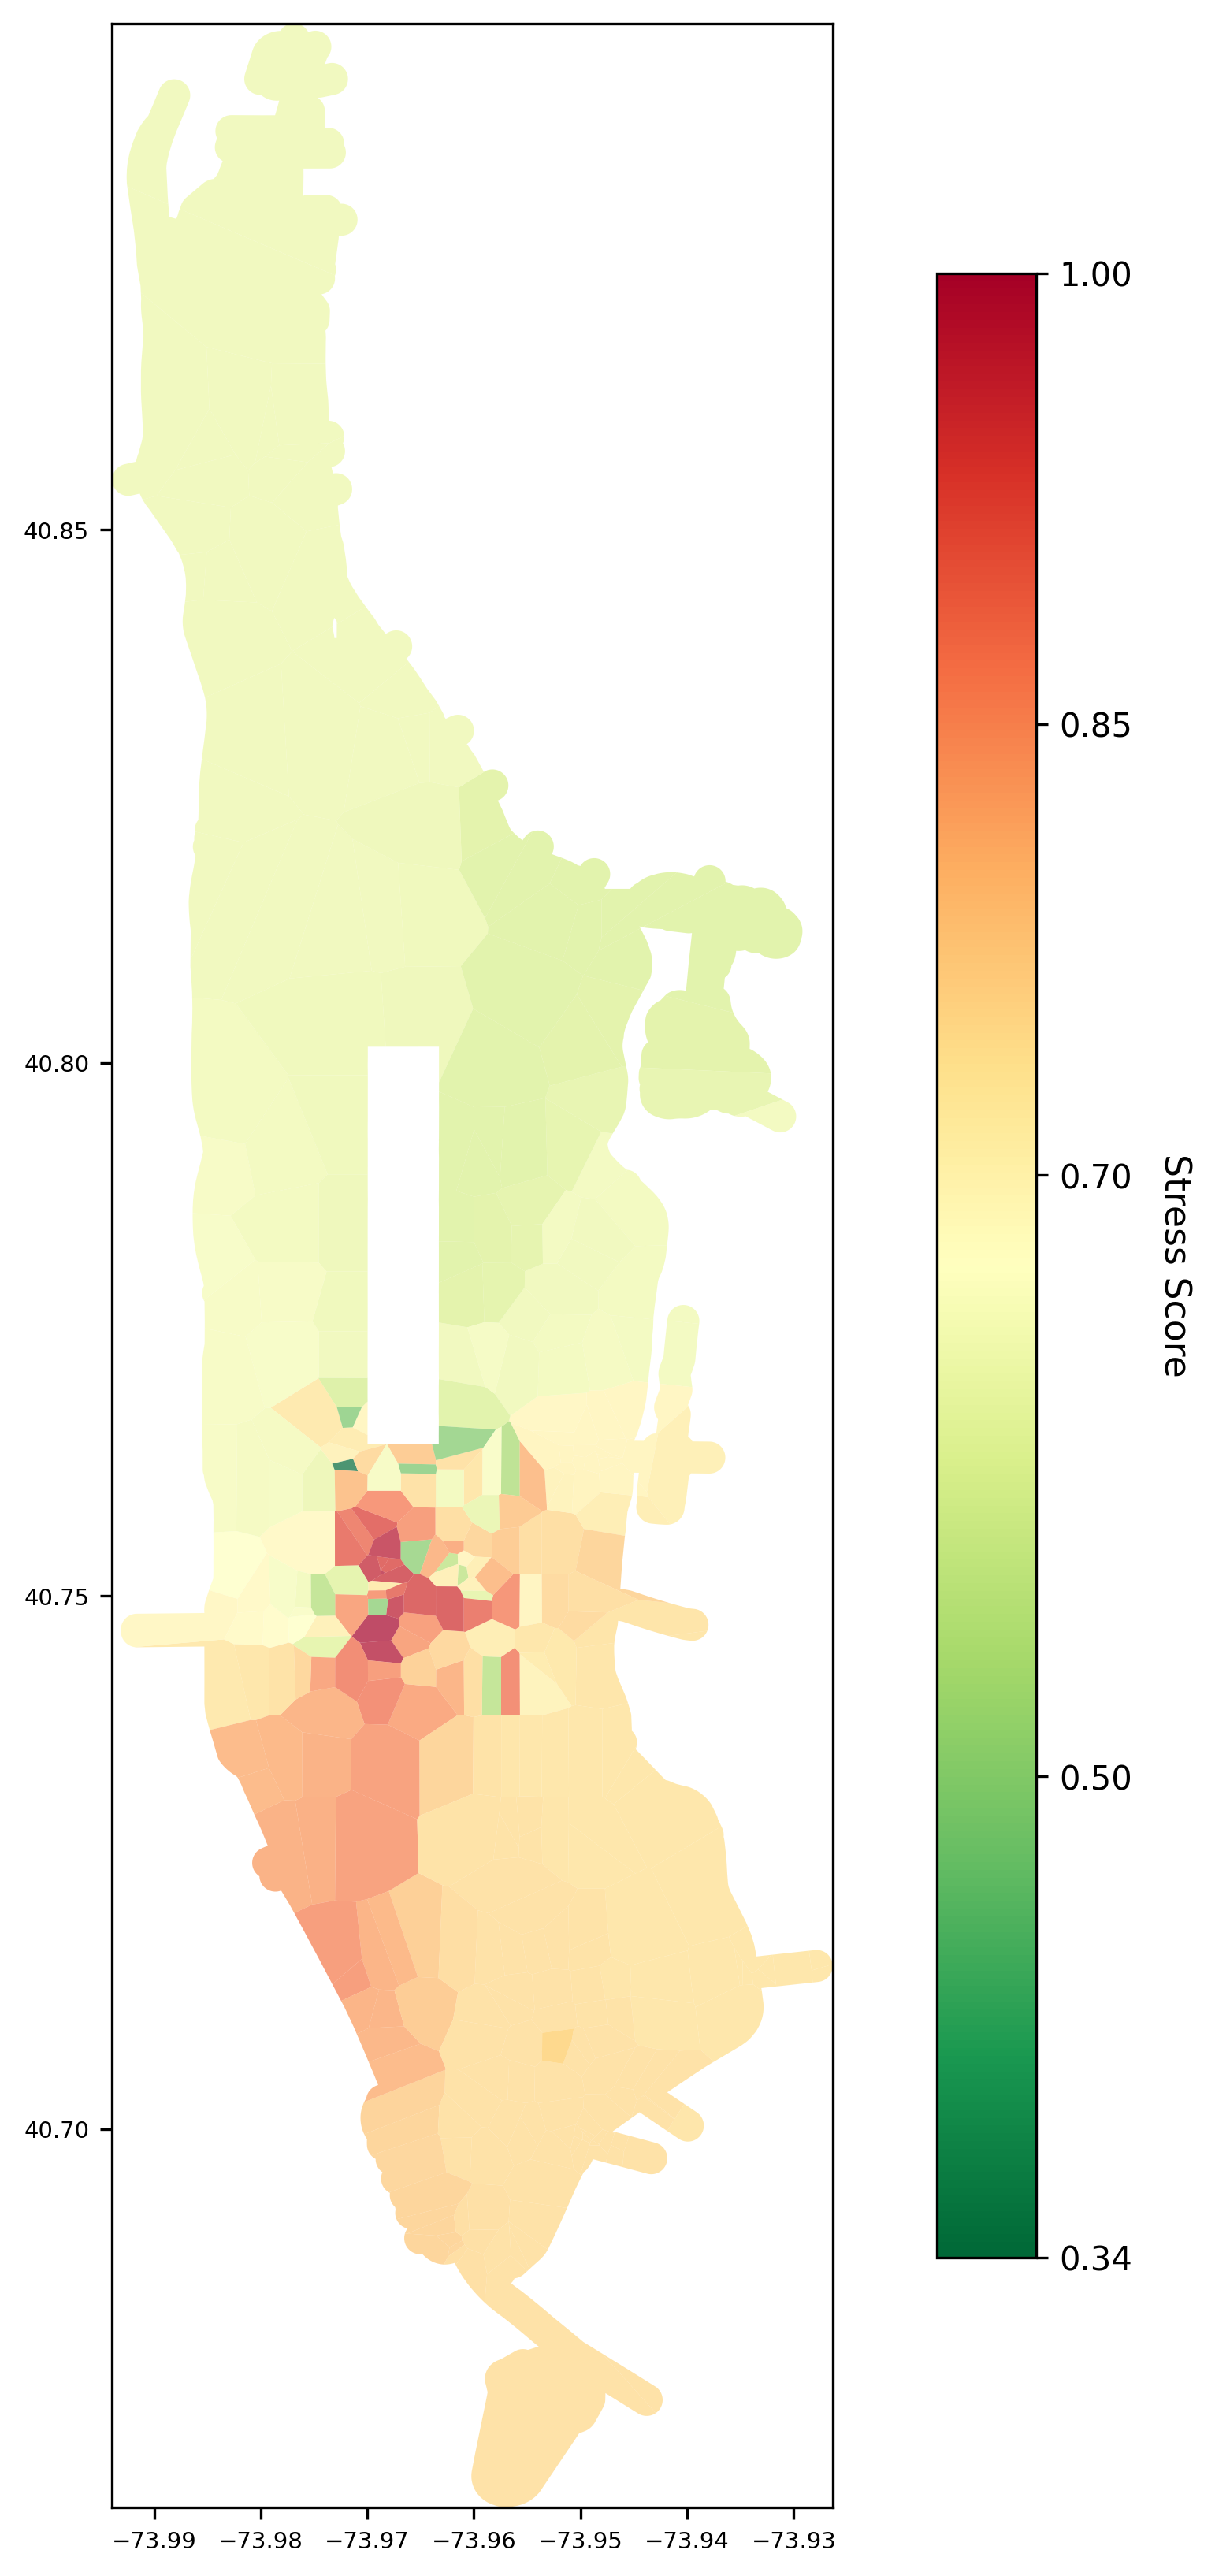
Figure
Camera-derived stress
Decision-locked Voronoi field. The substrate navigation reads.
Multi-panel figure
Nine origin–destination pairs
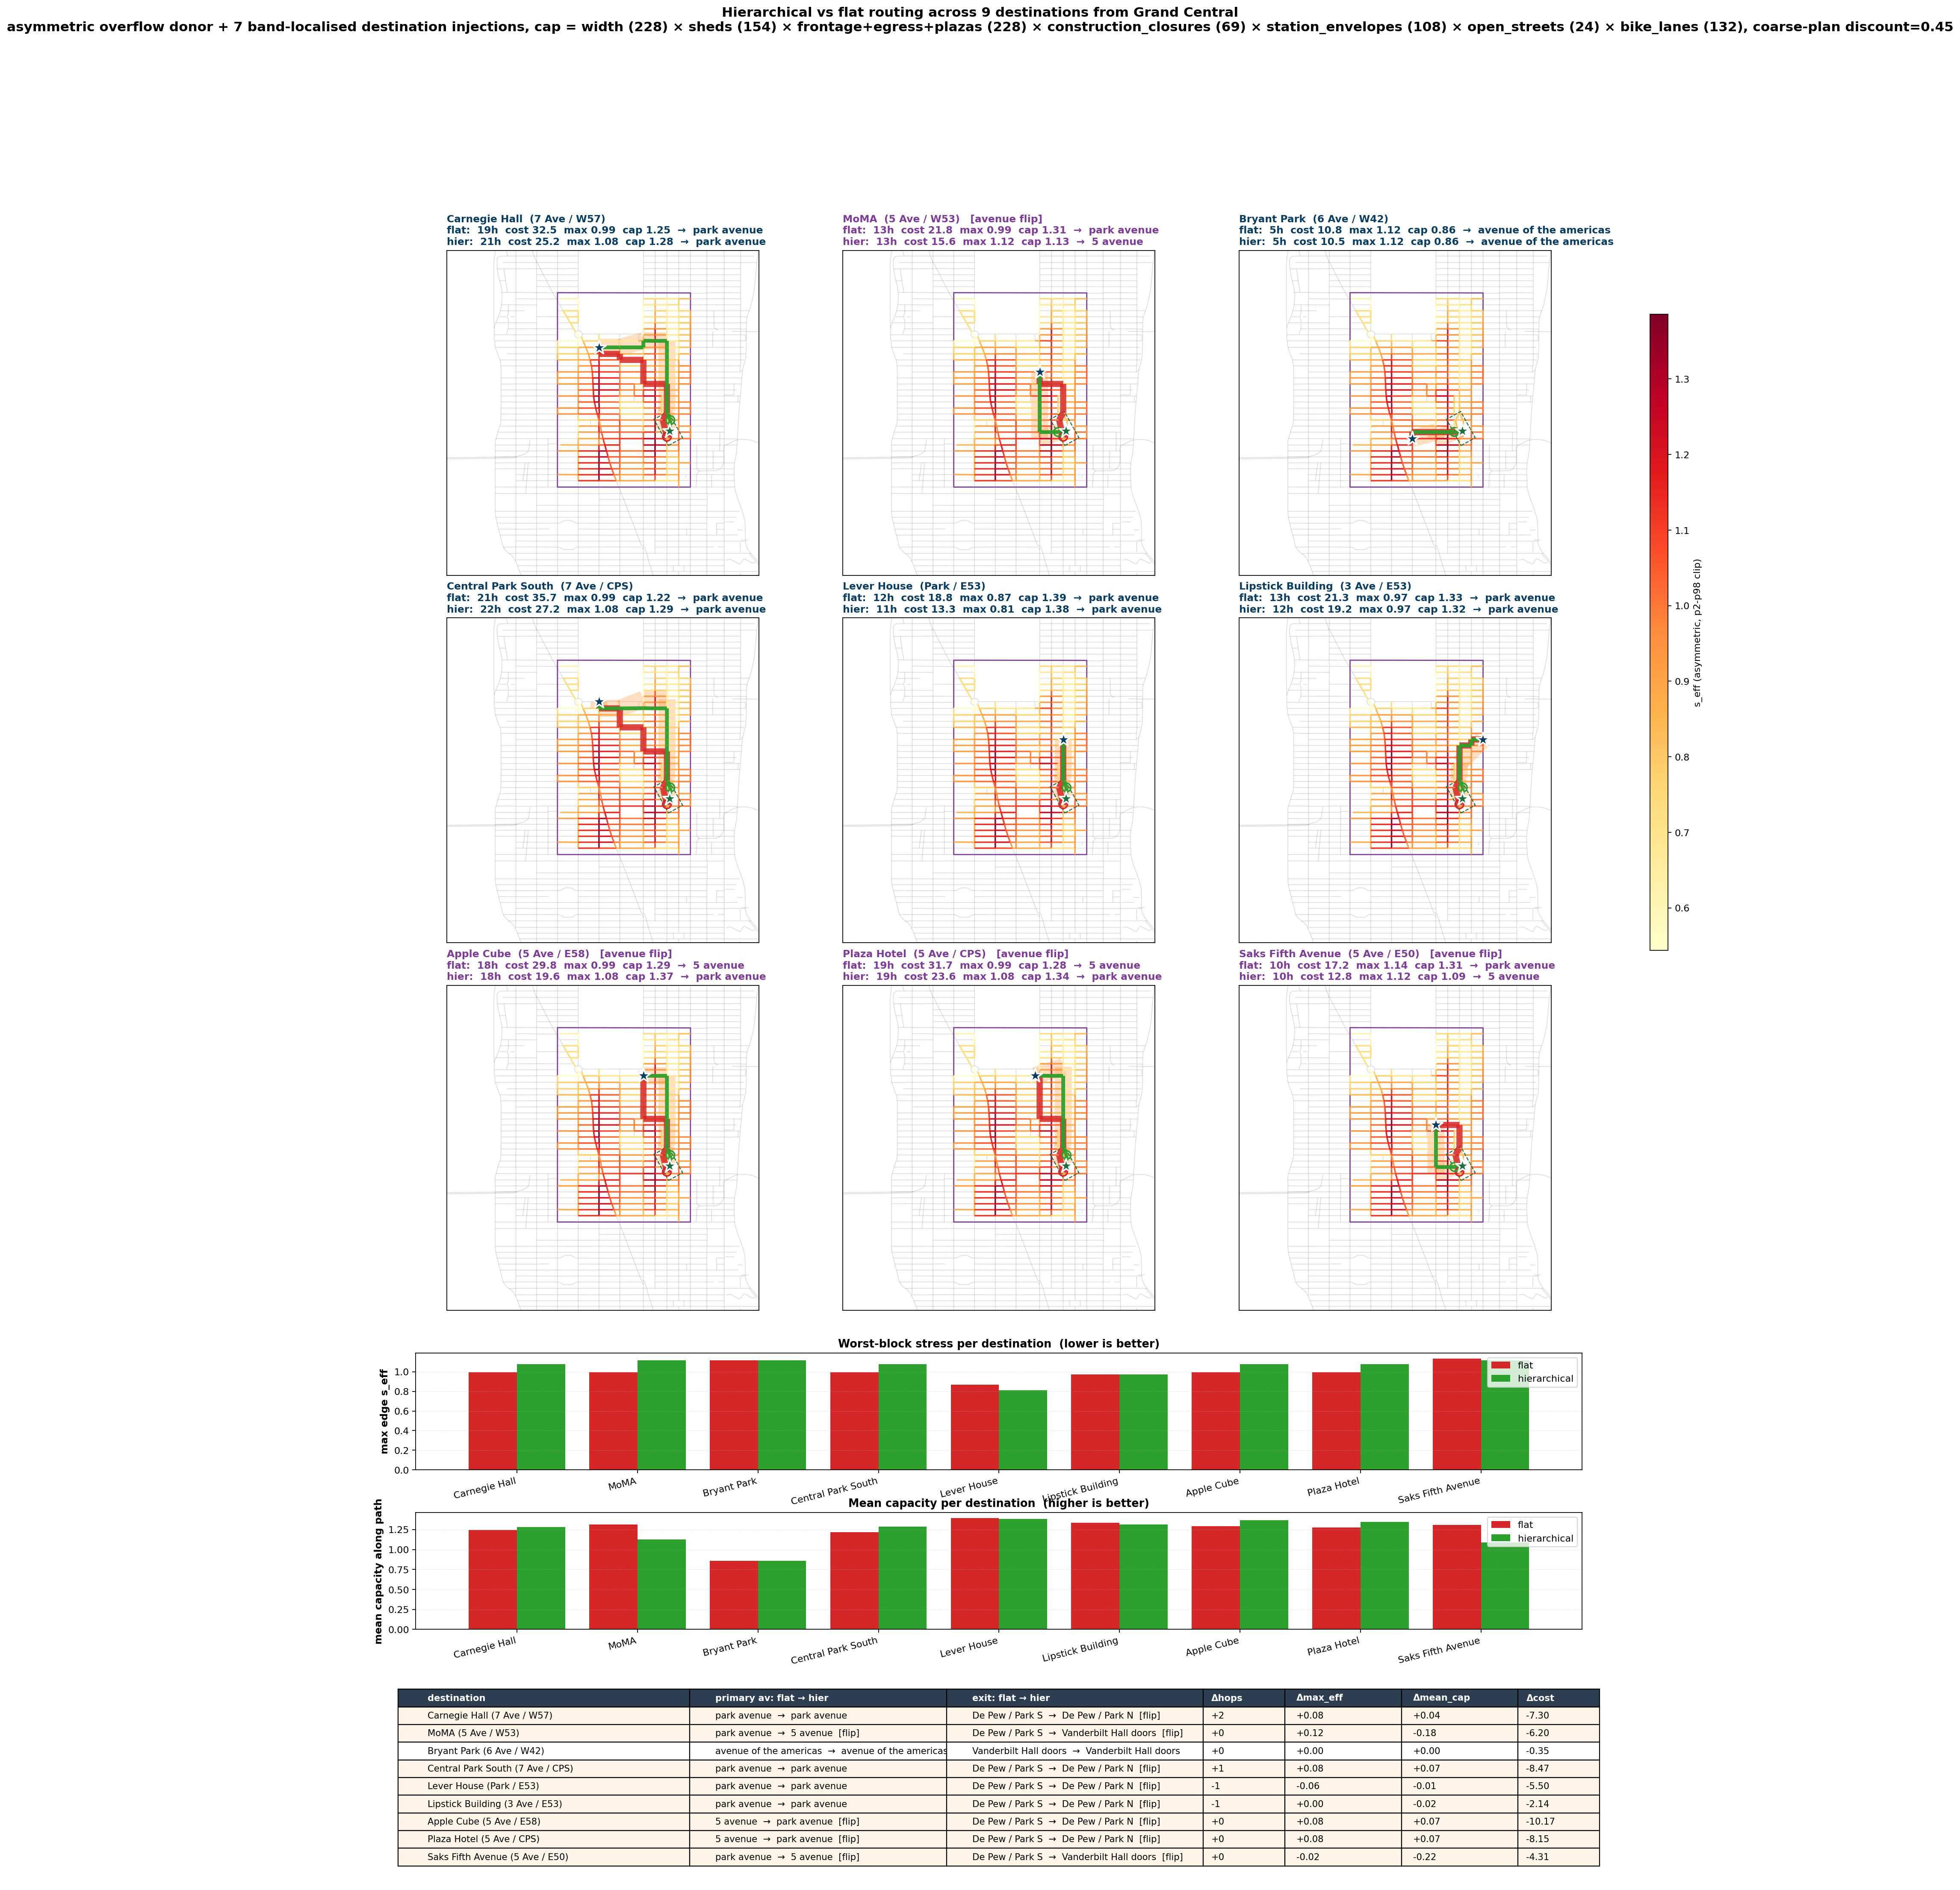
Structural contrast across nine corridor ODs: stress-aware paths diverge from hop-minimum paths where the field differs.
Figure
Shortest and stress-aware routes
Grand Central → Carnegie Hall: equal hops, lower accumulated stress on the stress-aware path.
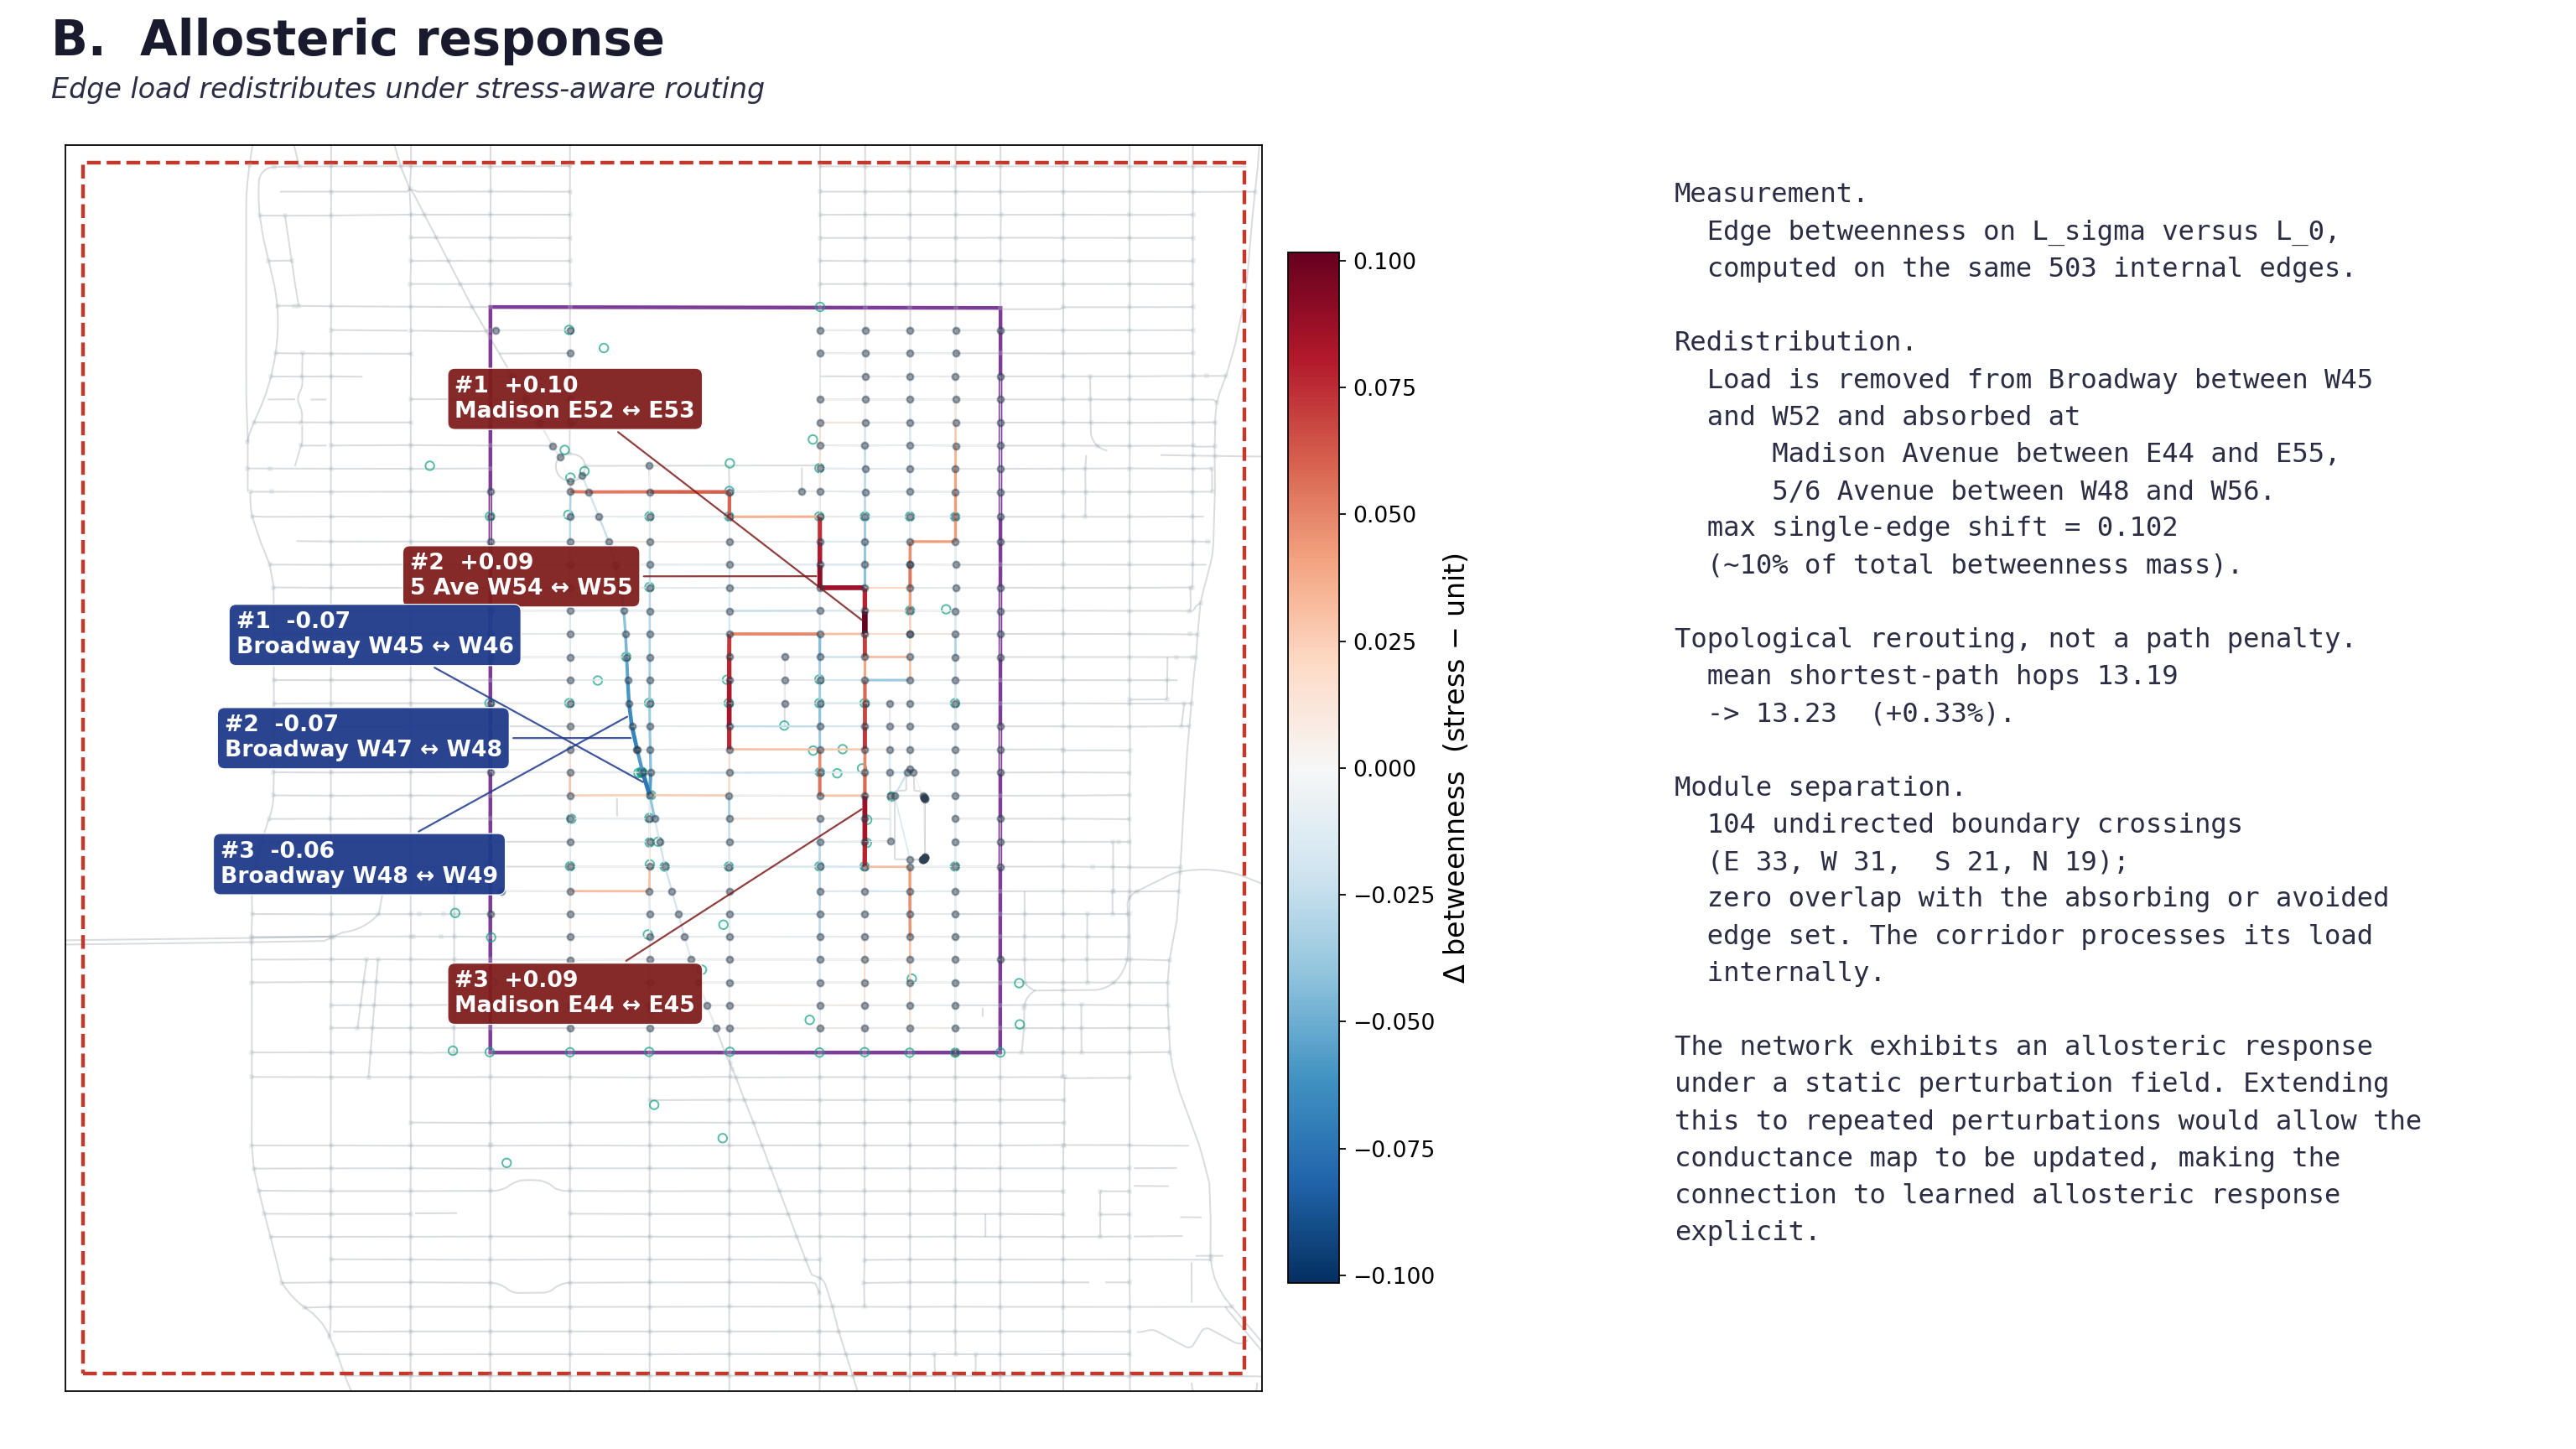
Corridor response
Load redistribution under stress
When routing cost weights the stress field, pedestrian load shifts across the full corridor graph. The pattern holds across many origin–destination pairs, beyond one demonstration walk.
Validation
What we claim today
- On Grand Central → Carnegie Hall, the stress-aware path carries lower measured stress at equal hops than the shortest-hop path.
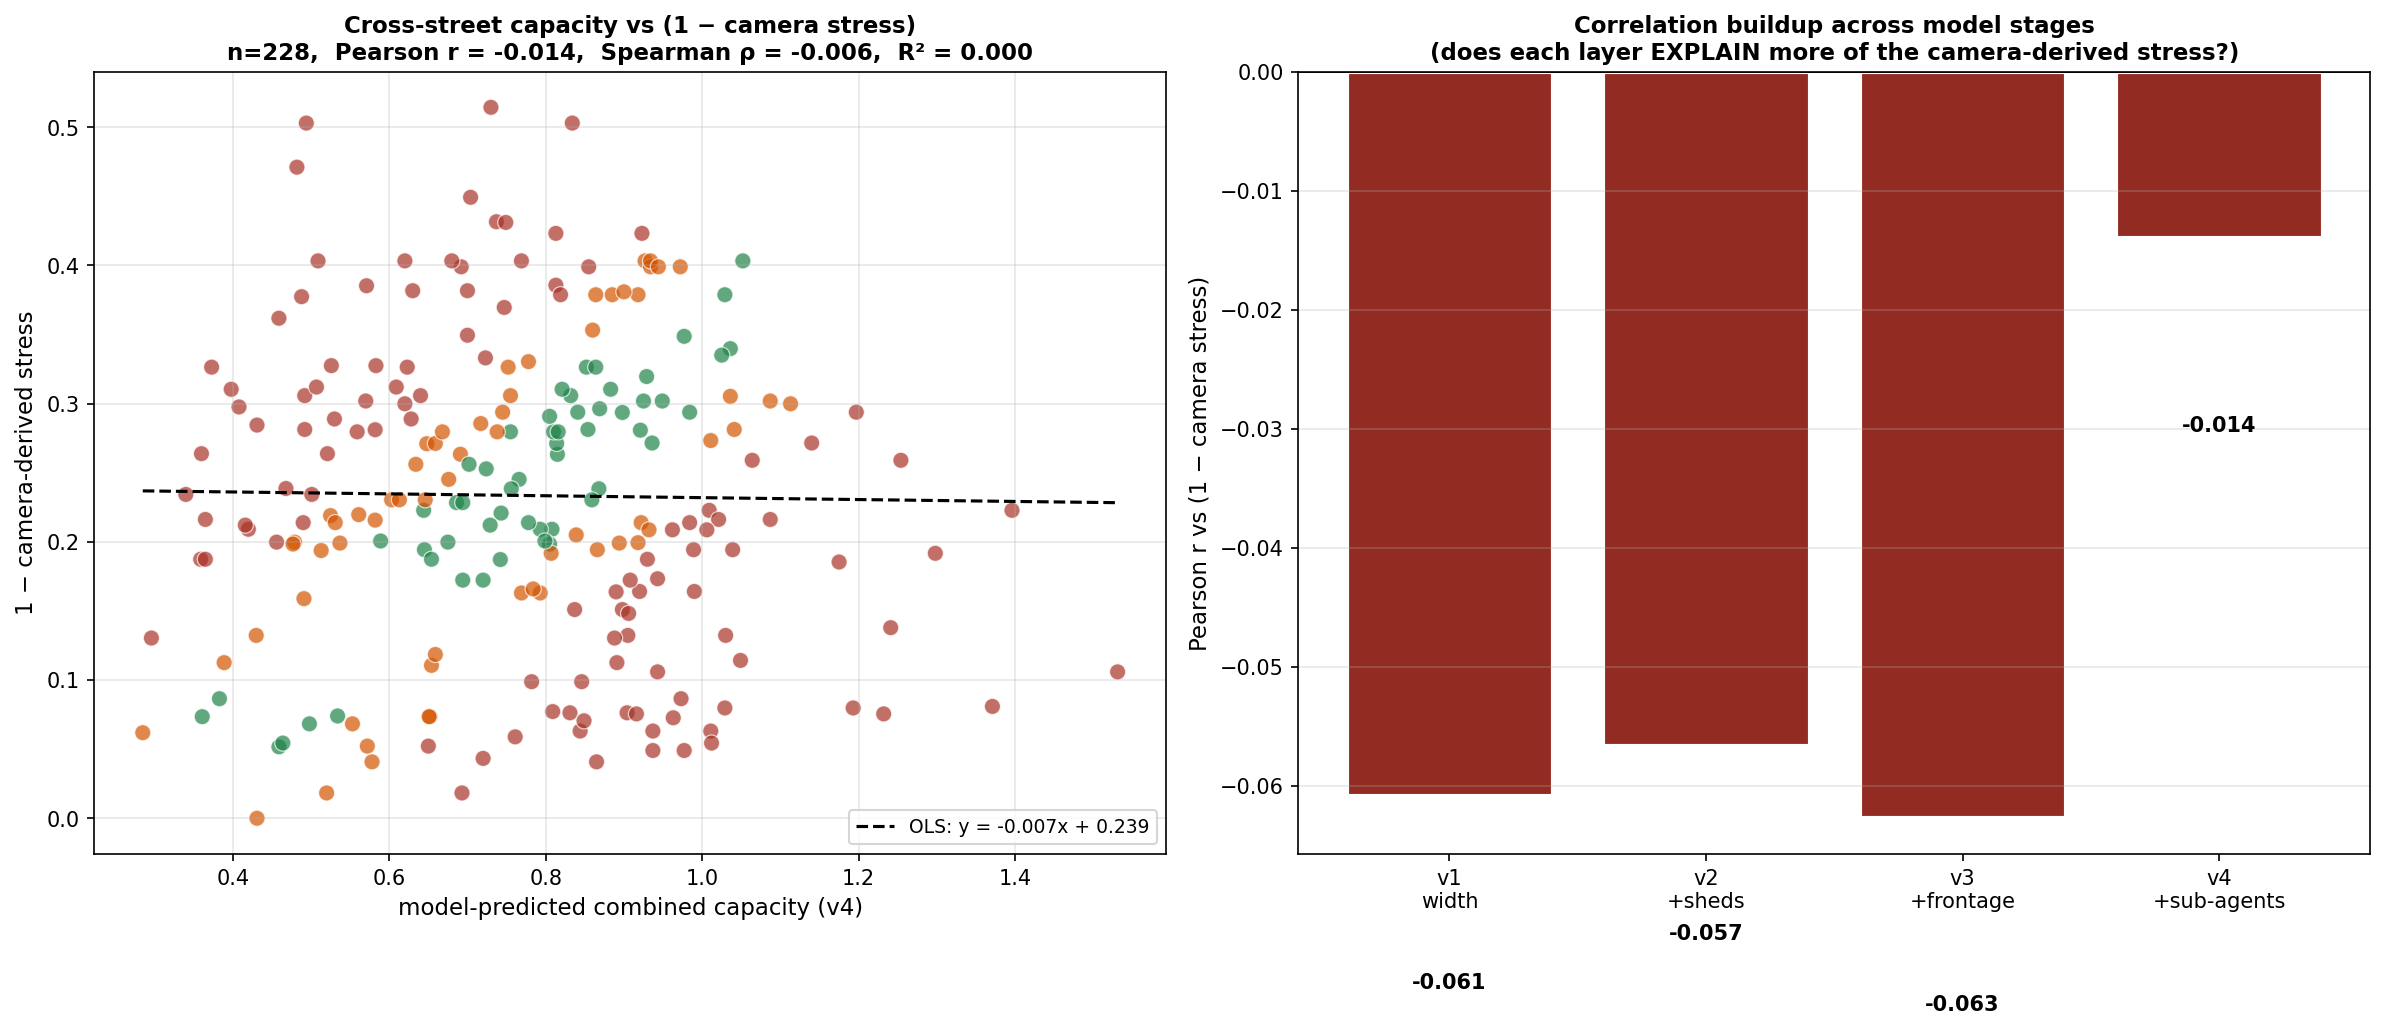
- Supply ⊥ demand at cross-street edges (r ≈ 0).
- Lived-knowledge check: 8/12 aligned, 0 misaligned (multi-informant study still needed).
Still to test: block-level pedestrian counts and behavioral trials.
Why this shape
What it means to build this way
- Public graph first. Open tables and camera stress on a locked corridor graph before navigation products embed the model.
- Documented order. Stress topology is fixed and published before path algorithms run.
- Bounded claims. Corridor-scale demonstrations others can reproduce; proprietary fusion and calibration stay separate from the open inputs.
- Room to choose. Hop-equivalent alternatives so walking between destinations stays a civic choice.
- Shared upkeep. A refresh story when sheds, closures, and cameras change the street.
Essay-length context: what it means to build.
Materials
Further reading
Gil Raitses · Syracuse University · patent pending
aimez.ai/public/executive-summary.html