This is category A in the executive summary map: how sensing becomes a field the router can read. It matches the IST 675 demonstration narrative at a high level; the full course appendix HTML lives outside this repo unless synced to AWS (see manifest).
Stages
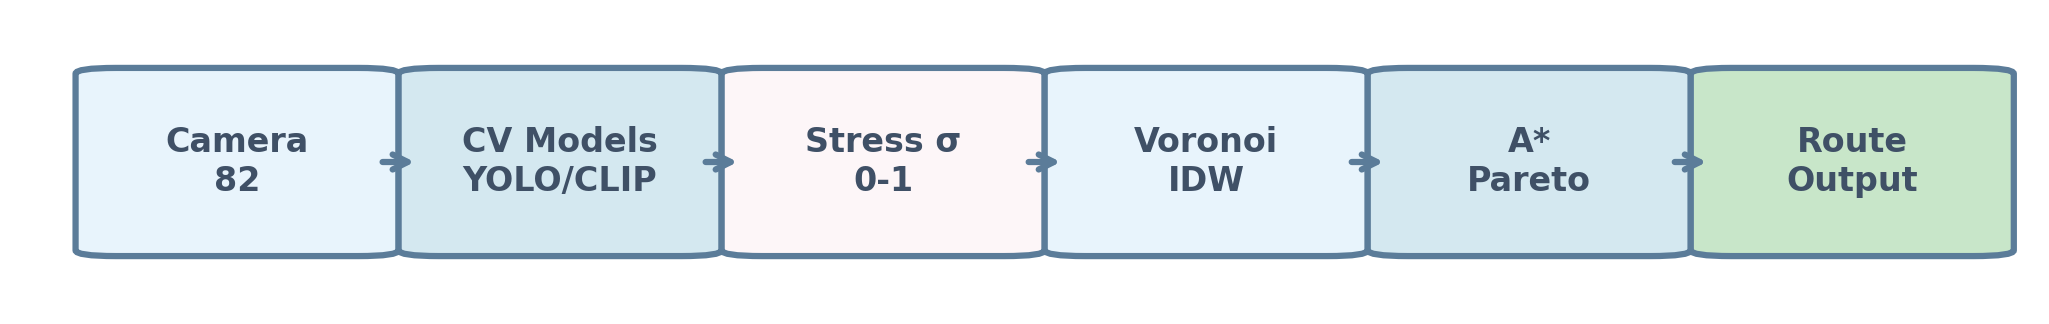
Ingest — Public NYC traffic camera frames on a fixed cadence (corridor-scale camera manifest).
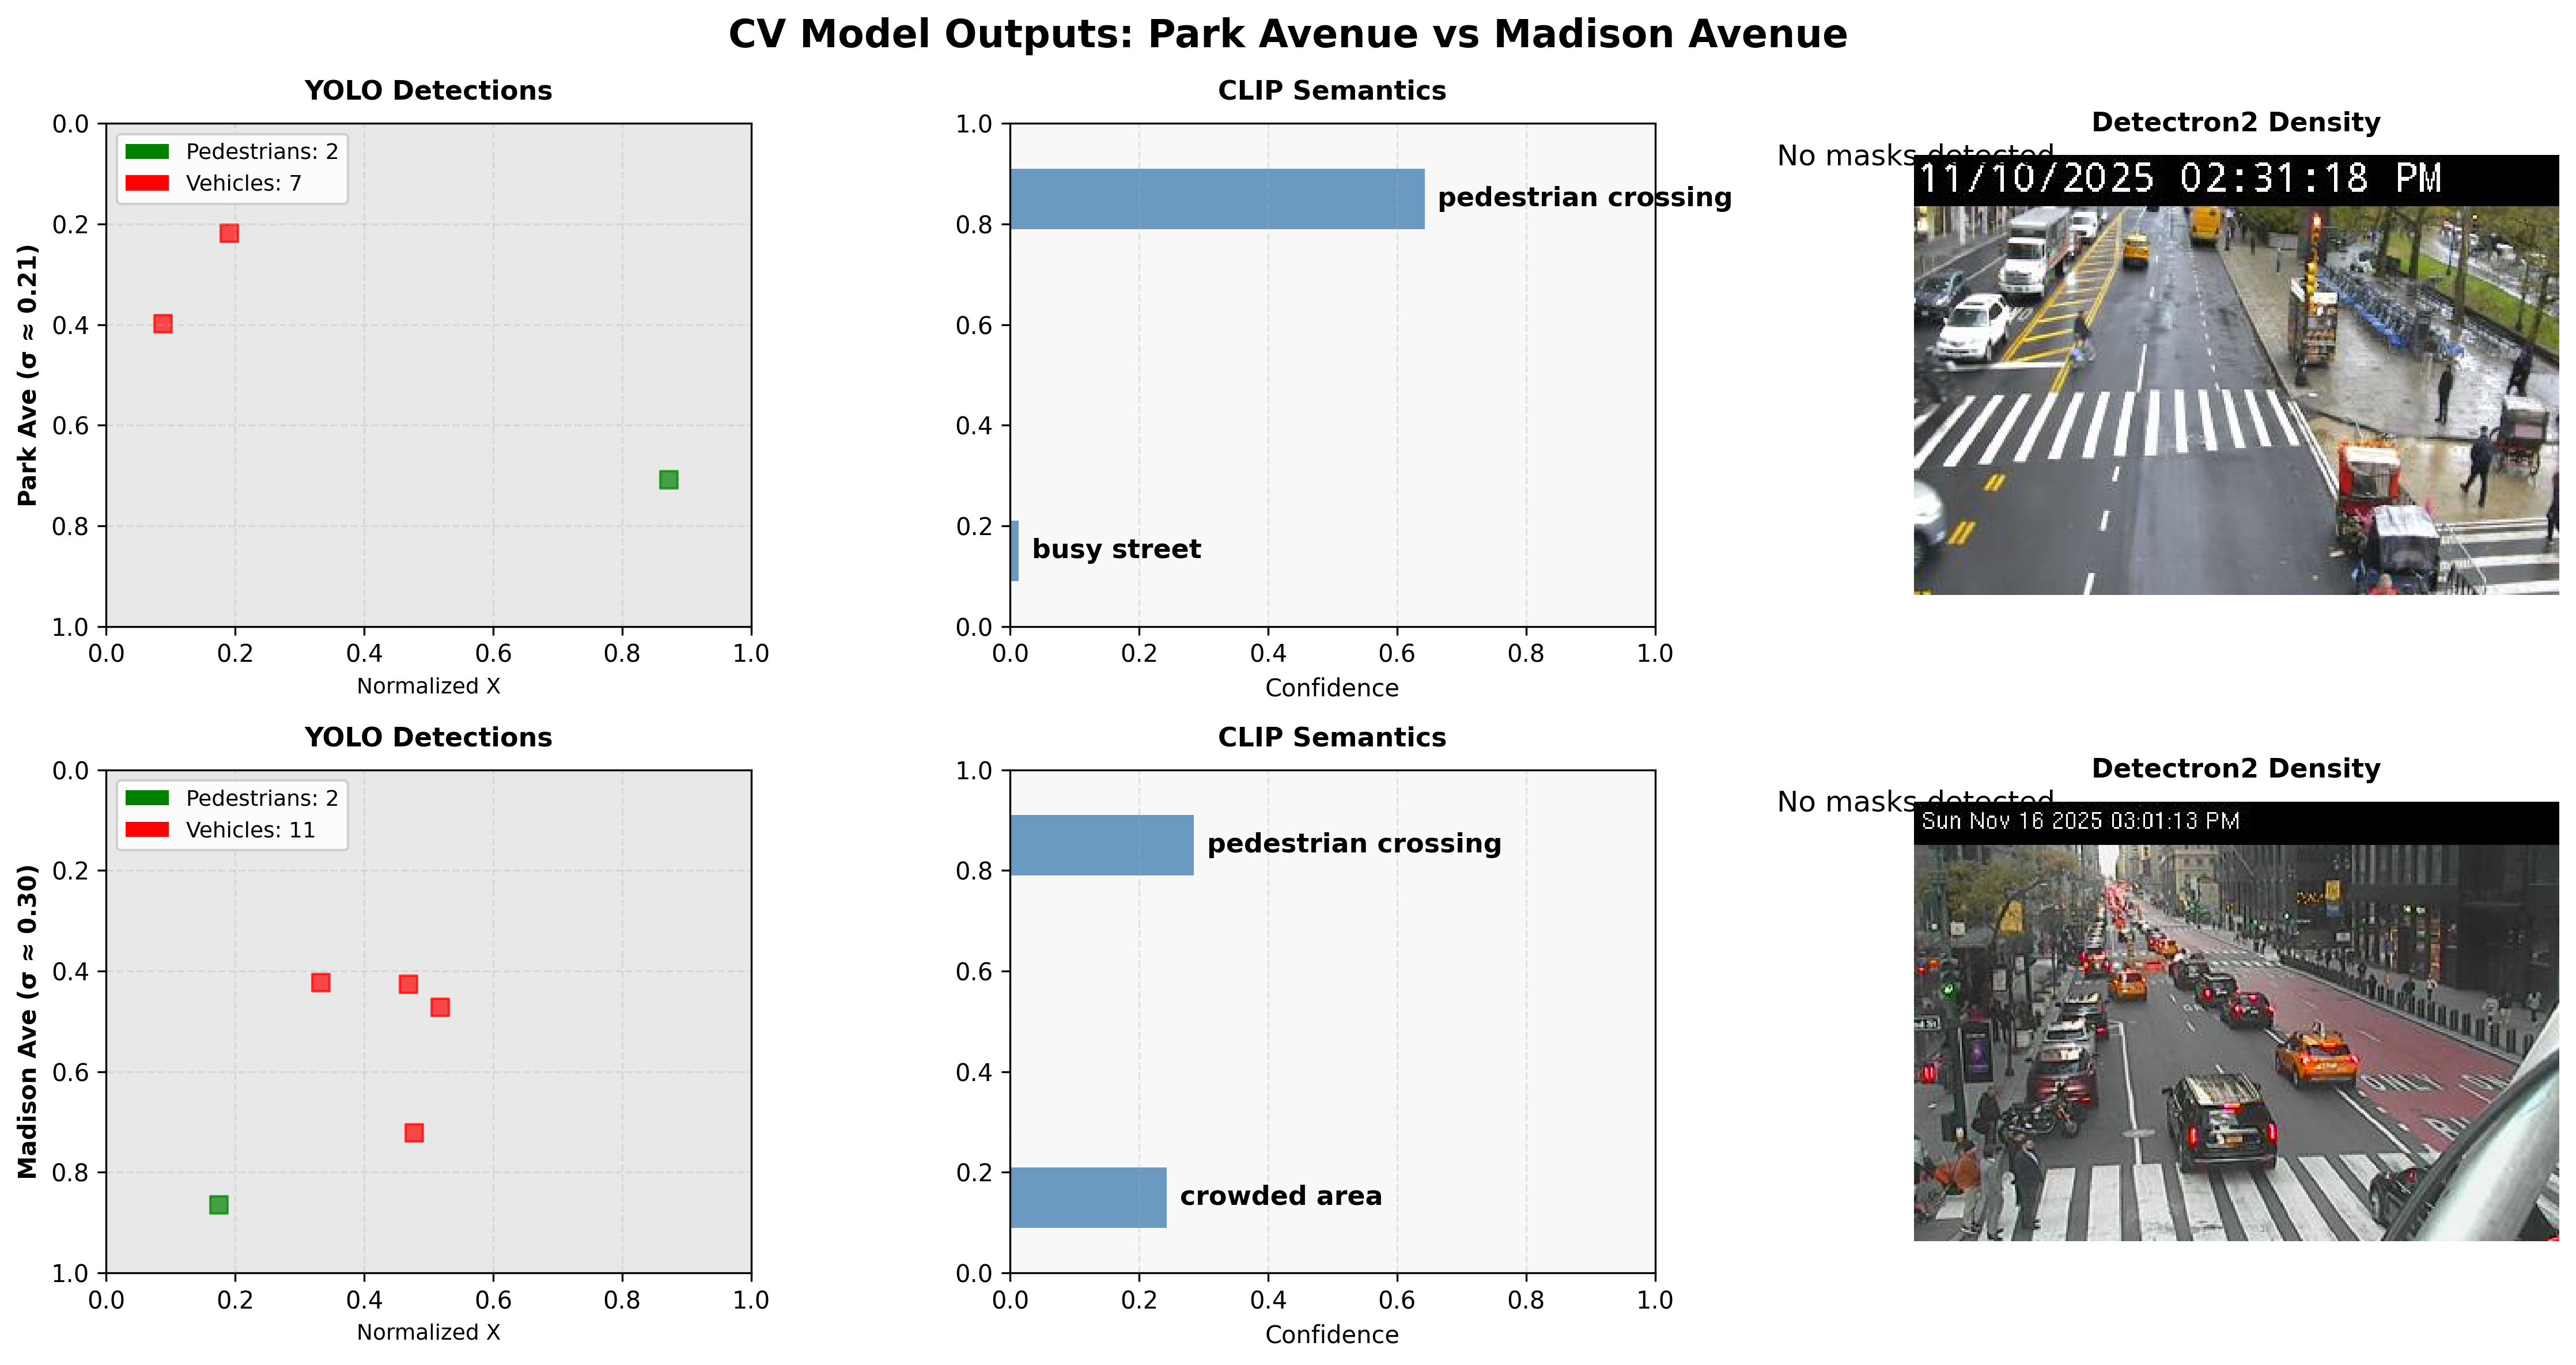
Perceive — YOLO (pedestrians/vehicles), CLIP scene semantics, Detectron2 density; fused into a per-camera stress score in [0, 1].
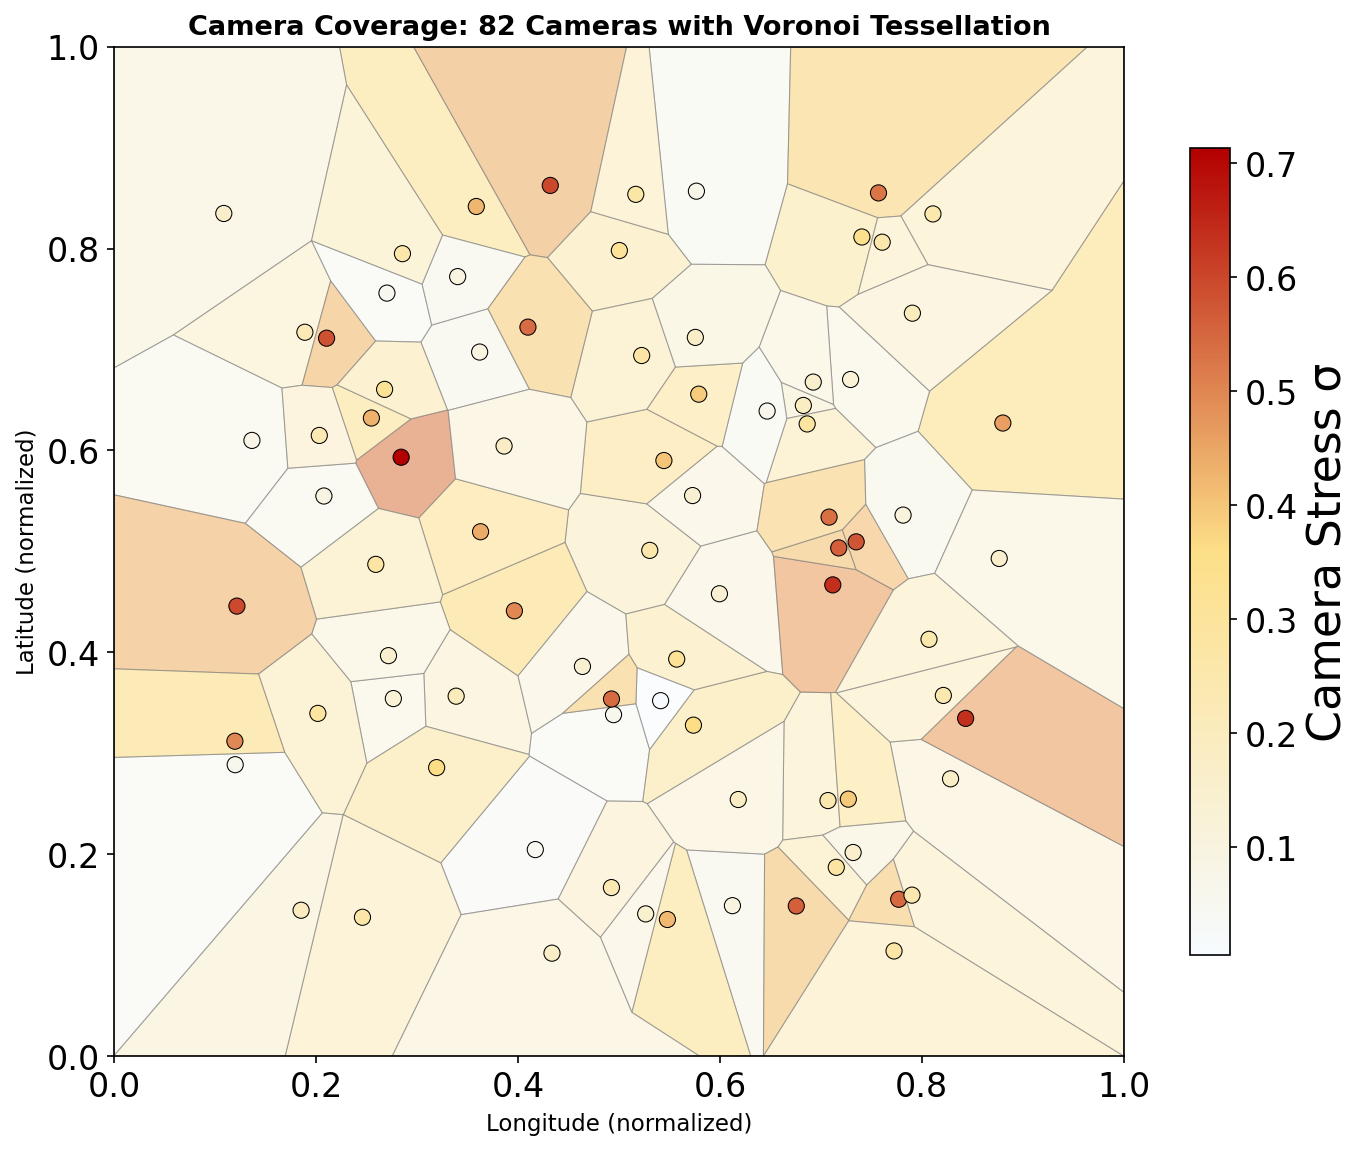
Spatialize — Voronoi tessellation from camera positions; optional IDW smoothing between cells.
Graph bind — Stress assigned to corridor intersections and directed edges; combined with Open Data capacity layers for routing cost.
End-to-end data flow: many cameras feed vision models; per-camera stress is interpolated to the graph; A* returns a path. Figure count in caption reflects the April 2026 corridor lock (gallery asset).Camera coverage with Voronoi cells colored by measured stress—allocentric anchoring of each score to a corridor region.Original camera data in-repo: This composite shows real traffic-camera frames with model overlays (detections and density), not synthetic scenes. Raw frame archives are not stored in git; only derived figures and JSON stress tables ship with the site and pax routing service.
What is not on this page
Supply-side capacity (sidewalk width, sheds, frontage, stations) comes from NYC Open Data, not from cameras. Orthogonality of the two layers is shown in the canonical walkthrough (§4.1). Substrate and validation figures are in Canonical figures walkthrough.